
Calculate the optimal aspect ratio of a line graph by banking the
slopes to 45 degrees as suggested by W.S. Cleveland. This
maximizes the ability to visually differentiate differences in
slope. This function will calculate the optimal aspect ratio for
a line plot using any of the methods described in Heer and Agrawala
(2006). In their review of the methods they suggest using median
absolute slope banking ("ms"), which produces aspect ratios which
are generally the median of the various methods provided here.
Usage
bank_slopes(
  x,
  y,
  cull = TRUE,
  weight = NULL,
  method = c("ms", "as", "ao", "was"),
  ...
)
Arguments
- x
A numeric vector of x values.
- y
A numeric vector of y values.
- cull
If
TRUE(the default), drop segments with a slope of 0 orInfbefore banking.- weight
![[Deprecated]](figures/lifecycle-deprecated.svg) No longer used, but kept
for backwards compatibility.
No longer used, but kept
for backwards compatibility.- method
The banking method, one of:
"ms", the default: median absolute slope."as": average absolute slope."ao": average absolute orientation."was": weighted average absolute orientation.
- ...
- No longer used, but kept for
backwards compatibility.
Value
A number, the aspect ratio y / x, for use as ratio in
ggplot2::coord_fixed().
Methods
As written, all of these methods calculate the aspect ratio (x
/y), but bank_slopes() will return (y / x) to be compatible
with ggplot2::coord_fixed().
Median Absolute Slopes Banking
Let the aspect ratio be \(\alpha = \frac{w}{h}\) then the median absolute slop banking is the \(\alpha\) such that, $$ median \left| \frac{s_i}{\alpha} \right| = 1 $$
Let \(R_z = z_{max} - z_{min}\) for \(z = x, y\), and \(M = median \| s_i \|\). Then, $$ \alpha = M \frac{R_x}{R_y} $$
Average Absolute Slope Banking
Let the aspect ratio be \(\alpha = \frac{w}{h}\). then the mean absolute slope banking is the \(\alpha\) such that, $$ mean \left| \frac{s_i}{\alpha} \right| = 1 $$
Average Absolute Orientation Banking
Rather than averaging the slopes themselves, this method averages the
orientation (angle) of each segment, since perceived slope
differences are more closely related to angle than to the raw ratio
\(dy/dx\). Let \(s'_i = s_i R_x / R_y\)
be the range-normalized slopes. Then \(\alpha\) is chosen such
that,
$$
mean \left| \arctan \left( \frac{s'_i}{\alpha} \right) \right| = \frac{\pi}{4}
$$
This has no closed-form solution and is found numerically with
stats::uniroot().
Weighted Average Absolute Orientation Banking
This is the weighted version of Average Absolute Orientation Banking from
Heer and Agrawala (2006). Each segment's absolute orientation is weighted
by its length in display space, so both the orientation and its weight
depend on \(\alpha\). With \(s'_i\) as above and segment run
\(dx_i\), \(\alpha\) is chosen such that,
$$
\frac{\sum_i \left|\arctan(s'_i / \alpha)\right|
dx_i \sqrt{1 + (s'_i / \alpha)^2}}
{\sum_i dx_i \sqrt{1 + (s'_i / \alpha)^2}} = \frac{\pi}{4}
$$
This has no closed-form solution and is found numerically with
stats::uniroot().
All of these methods consider the entirety of the data at once, so they
accentuate local features and can obscure larger-scale trends. Heer and
Agrawala (2006) address this with multi-scale banking, which uses spectral
analysis to identify the frequency scales present in the data and banks
each one separately; see bank_slopes_multiscale() and
bank_plot_multiscale().
References
Cleveland, W. S., M. E. McGill, and R. McGill. The Shape Parameter of a Two-Variable Graph. Journal of the American Statistical Association, 83:289-300, 1988
Heer, Jeffrey and Maneesh Agrawala, 2006. 'Multi-Scale Banking to 45' IEEE Transactions On Visualization And Computer Graphics.
Cleveland, W. S. 1993. 'A Model for Studying Display Methods of Statistical Graphs.' Journal of Computational and Statistical Graphics.
Cleveland, W. S. 1994. The Elements of Graphing Data, Revised Edition.
See also
lattice::banking(), bank_plot() to bank
a ggplot using its own data, and
bank_slopes_multiscale() to bank each frequency scale in the
data separately.
Examples
library("ggplot2")
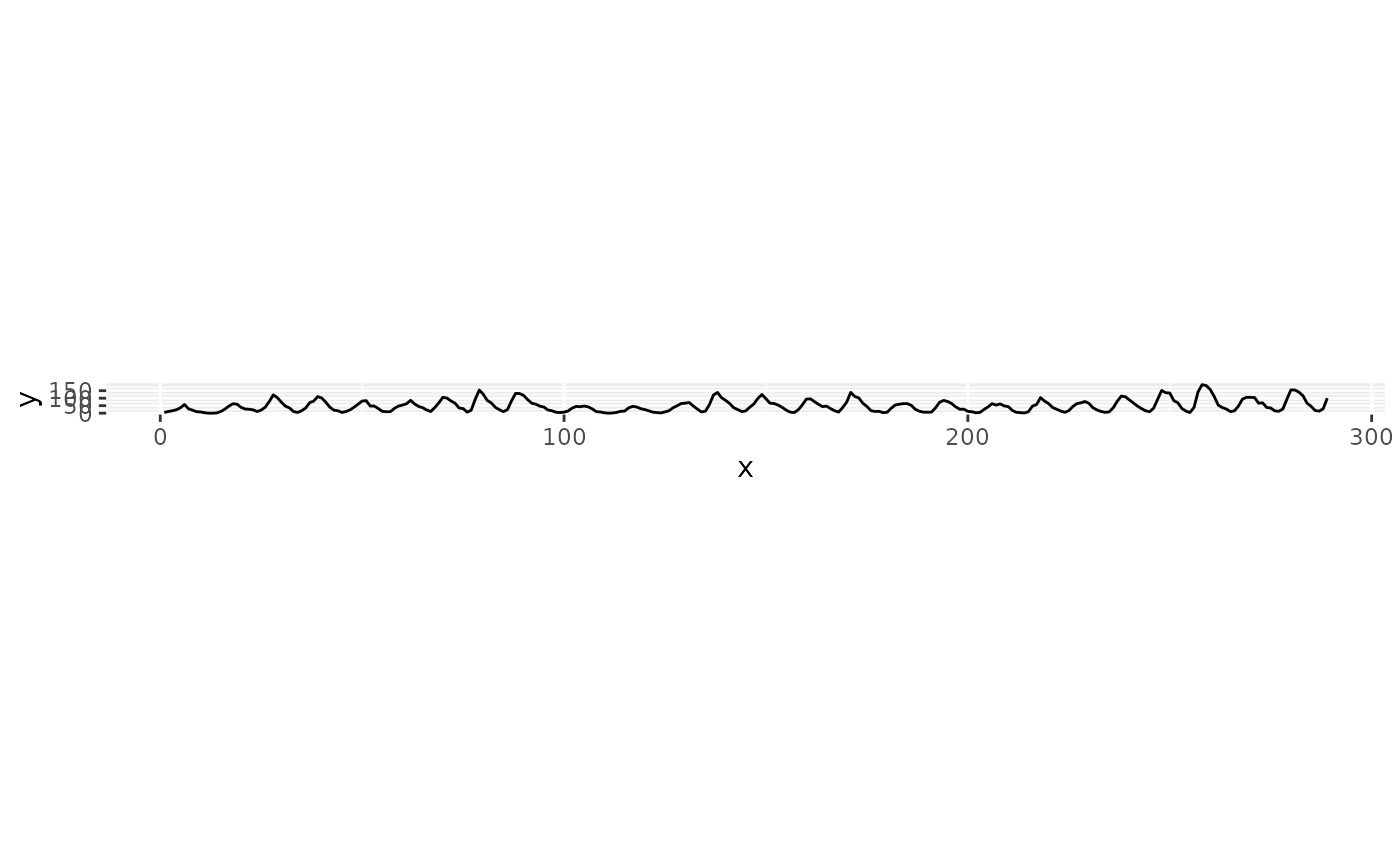
# Use the classic sunspot data from Cleveland's original paper
x <- seq_along(sunspot.year)
y <- as.numeric(sunspot.year)
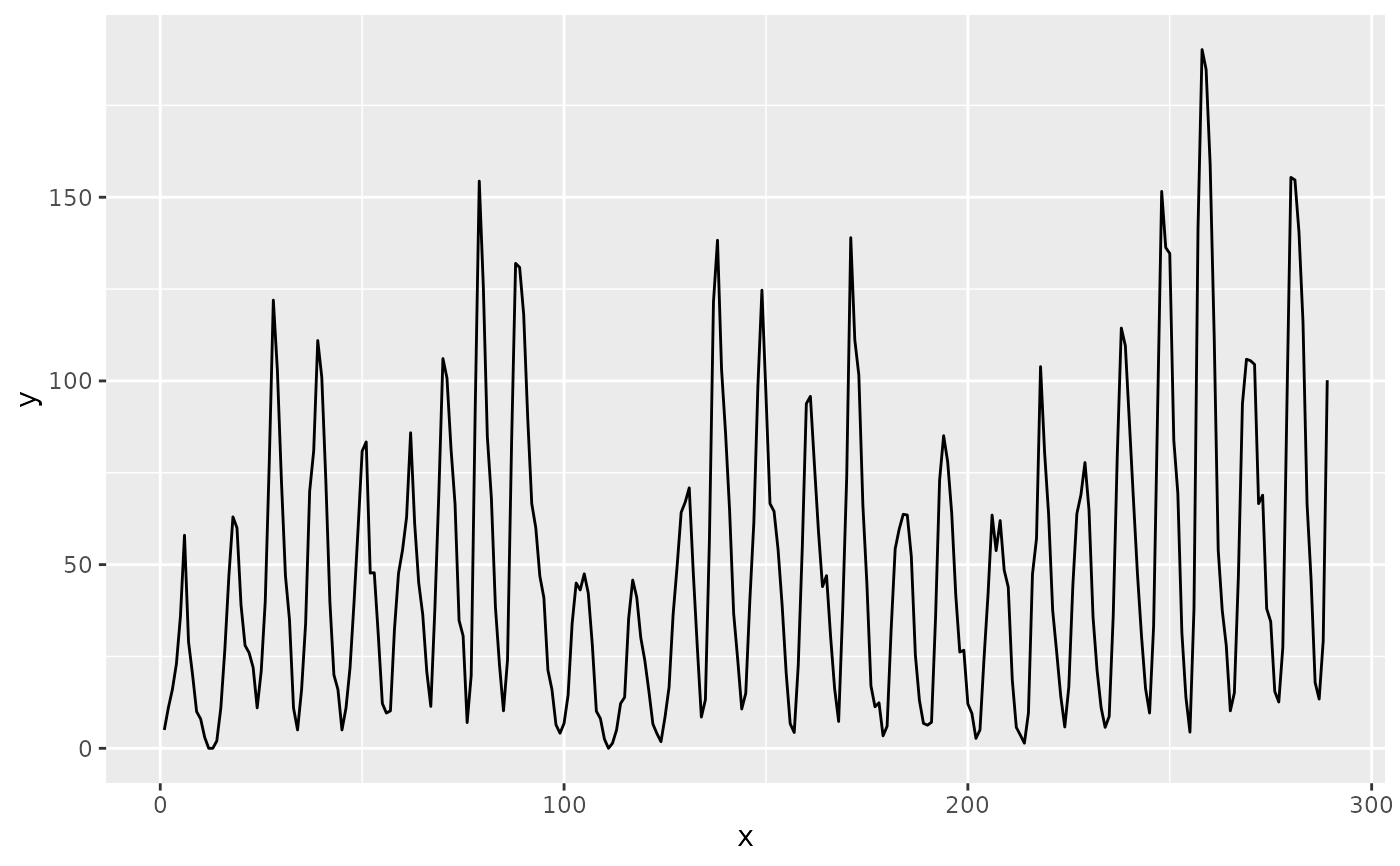
# Without banking
m <- ggplot(data.frame(x = x, y = y), aes(x = x, y = y)) +
geom_line()
m
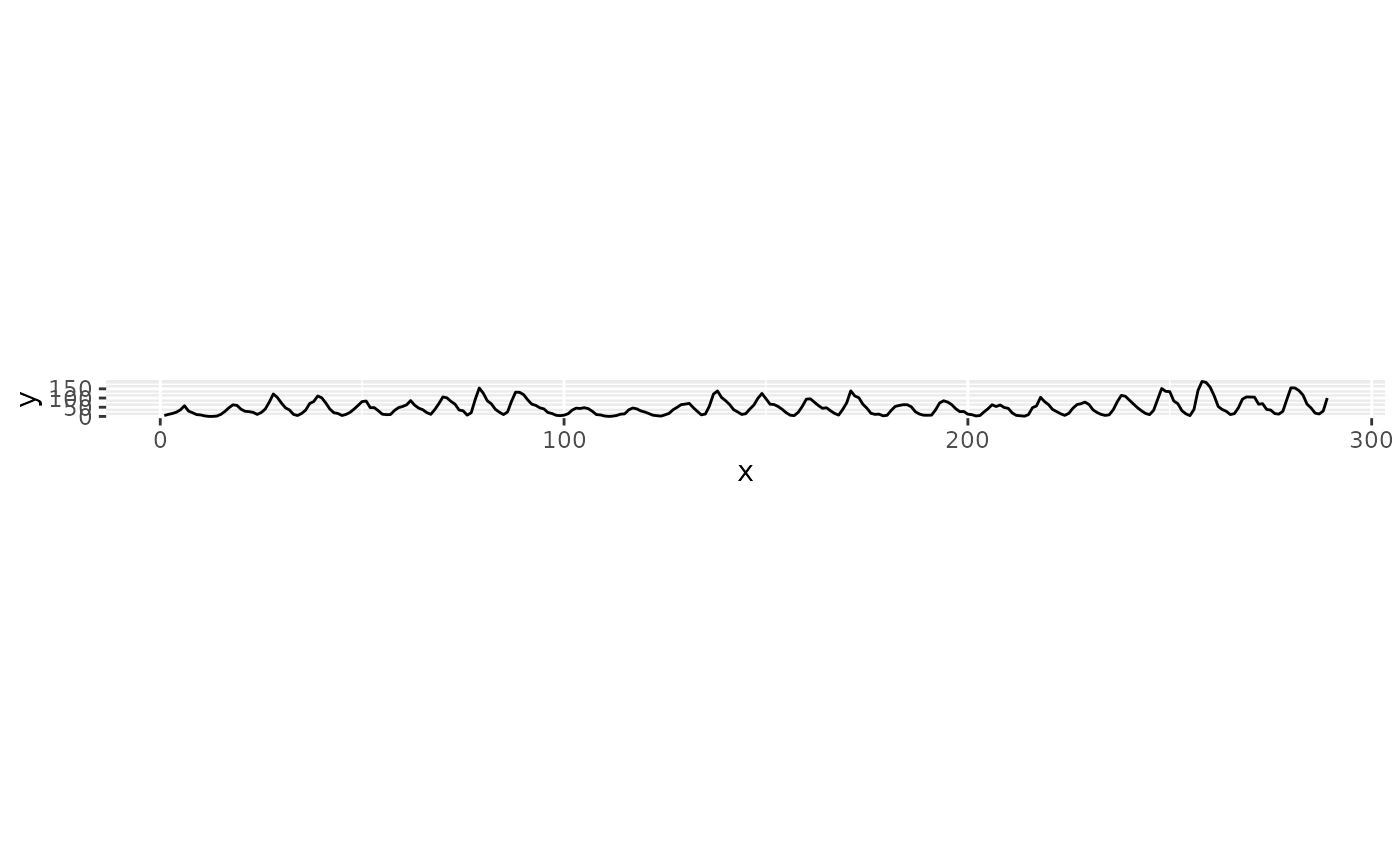
 ## Using the default method, Median Absolute Slope
ratio <- bank_slopes(x, y)
m + coord_fixed(ratio = ratio)
## Using the default method, Median Absolute Slope
ratio <- bank_slopes(x, y)
m + coord_fixed(ratio = ratio)
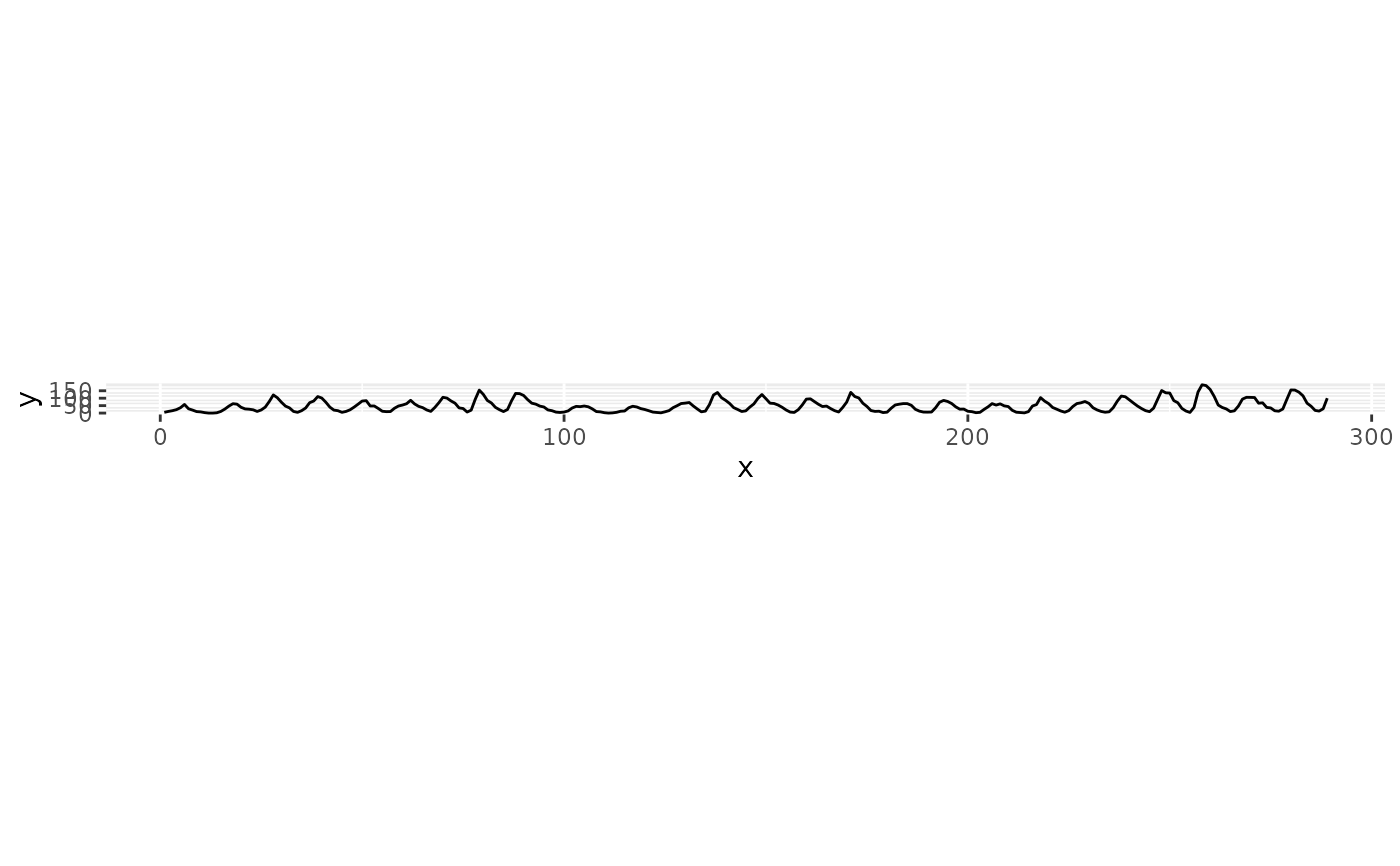
 ## Average Absolute Slope
m + coord_fixed(ratio = bank_slopes(x, y, method = "as"))
## Average Absolute Slope
m + coord_fixed(ratio = bank_slopes(x, y, method = "as"))
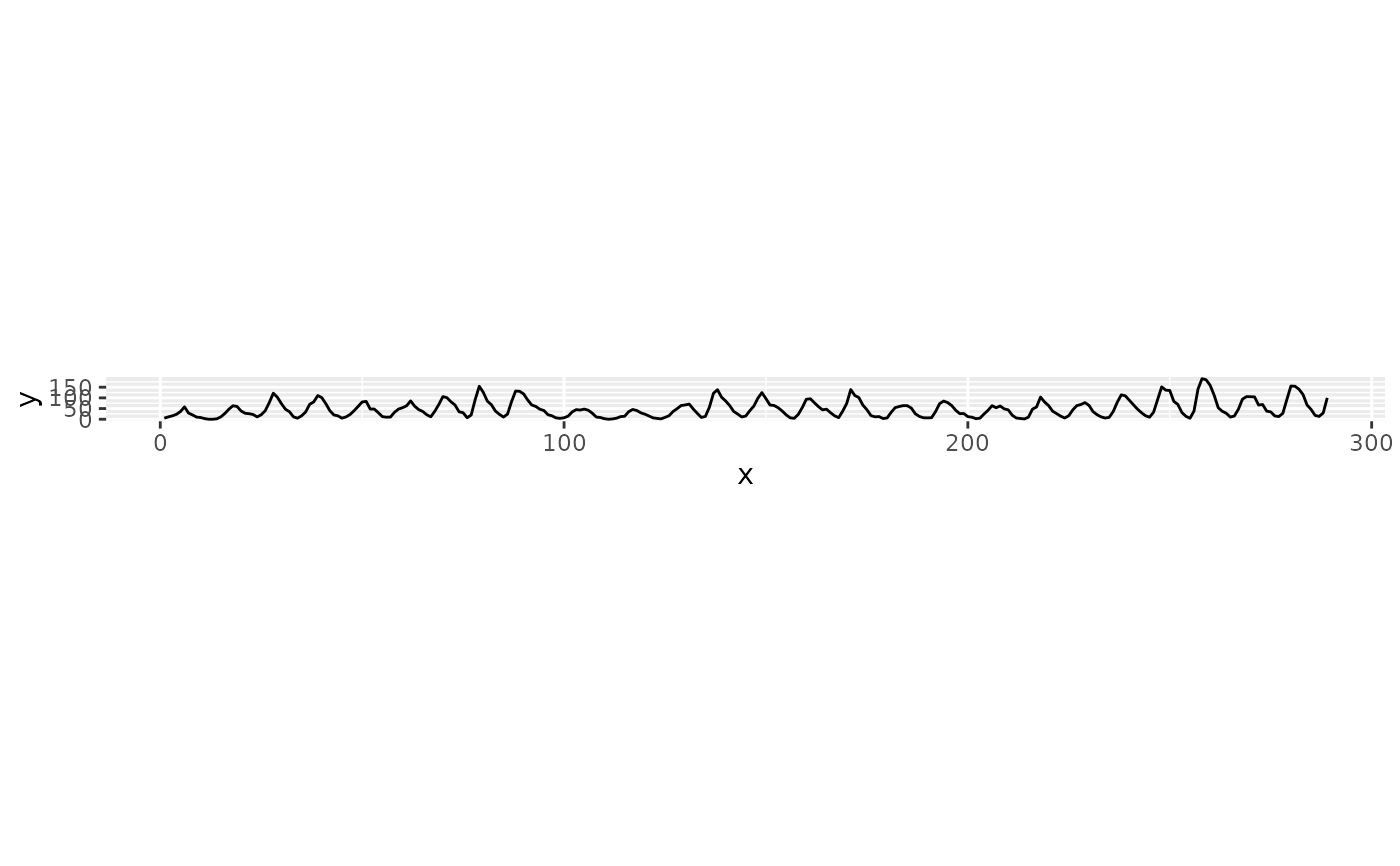
 ## Average Absolute Orientation
m + coord_fixed(ratio = bank_slopes(x, y, method = "ao"))
## Average Absolute Orientation
m + coord_fixed(ratio = bank_slopes(x, y, method = "ao"))
 ## Weighted Average Absolute Slope: each segment is weighted by its run in
## x, so this only differs from "as" when x is not evenly spaced
m + coord_fixed(ratio = bank_slopes(x, y, method = "was"))
## Weighted Average Absolute Slope: each segment is weighted by its run in
## x, so this only differs from "as" when x is not evenly spaced
m + coord_fixed(ratio = bank_slopes(x, y, method = "was"))
 ## Culling removes slopes of 0 or Inf before banking, which matters when
## the data contains runs of repeated x or y values
bank_slopes(x, y, cull = TRUE)
#> [1] 0.04554598
## Culling removes slopes of 0 or Inf before banking, which matters when
## the data contains runs of repeated x or y values
bank_slopes(x, y, cull = TRUE)
#> [1] 0.04554598