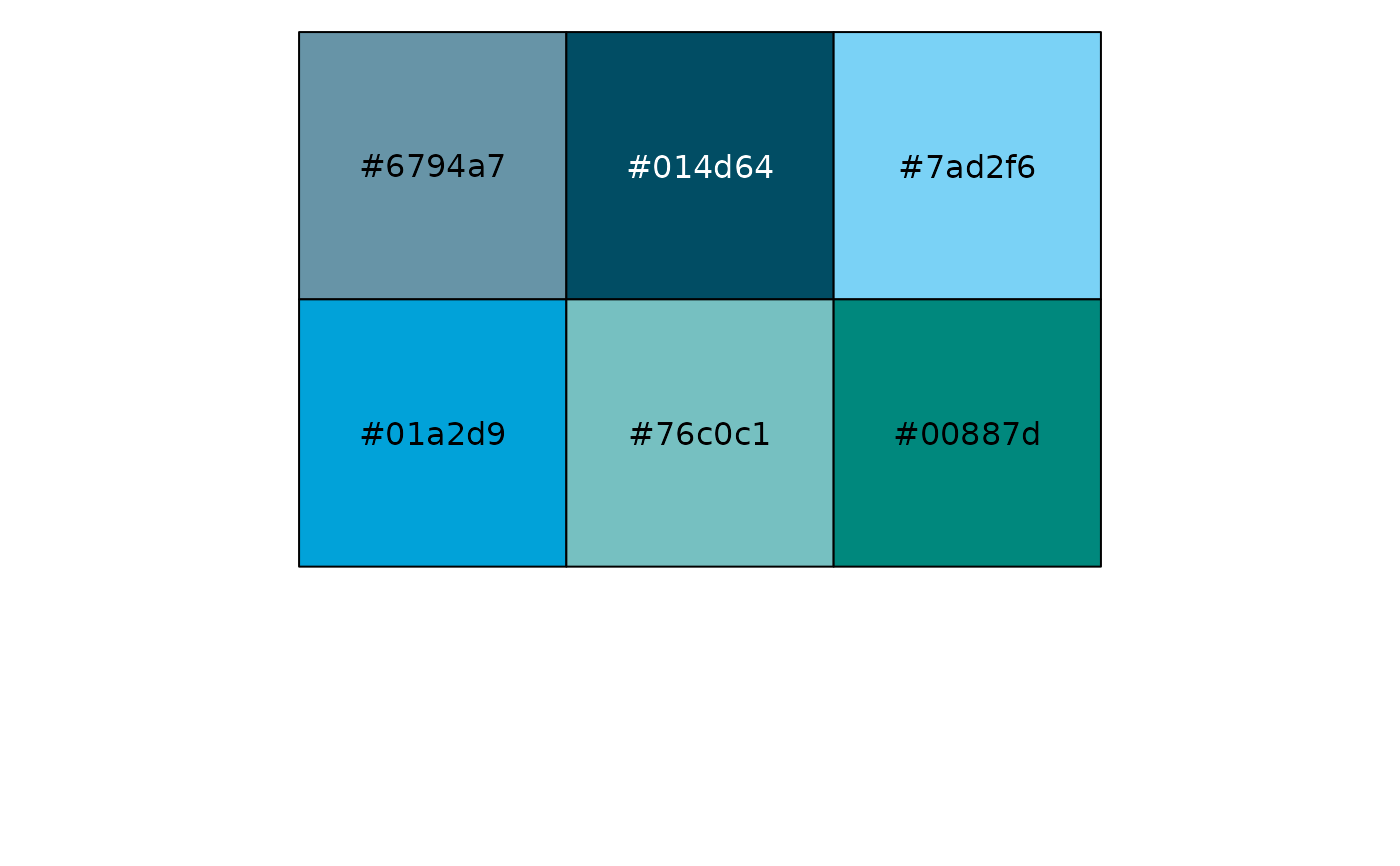
The classic The Economist chart palette: blues, grays, and greens, chosen and ordered for the number of colors requested. Red is not included in these palettes; The Economist reserves it to mark important data.
Value
A palette function. It takes the number of colors n and returns a character vector of n
hex colors, and can be used as the palette argument of ggplot2::discrete_scale().
See also
Other color economist:
economist_seq_pal(),
scale_colour_economist(),
scale_colour_economist_c()