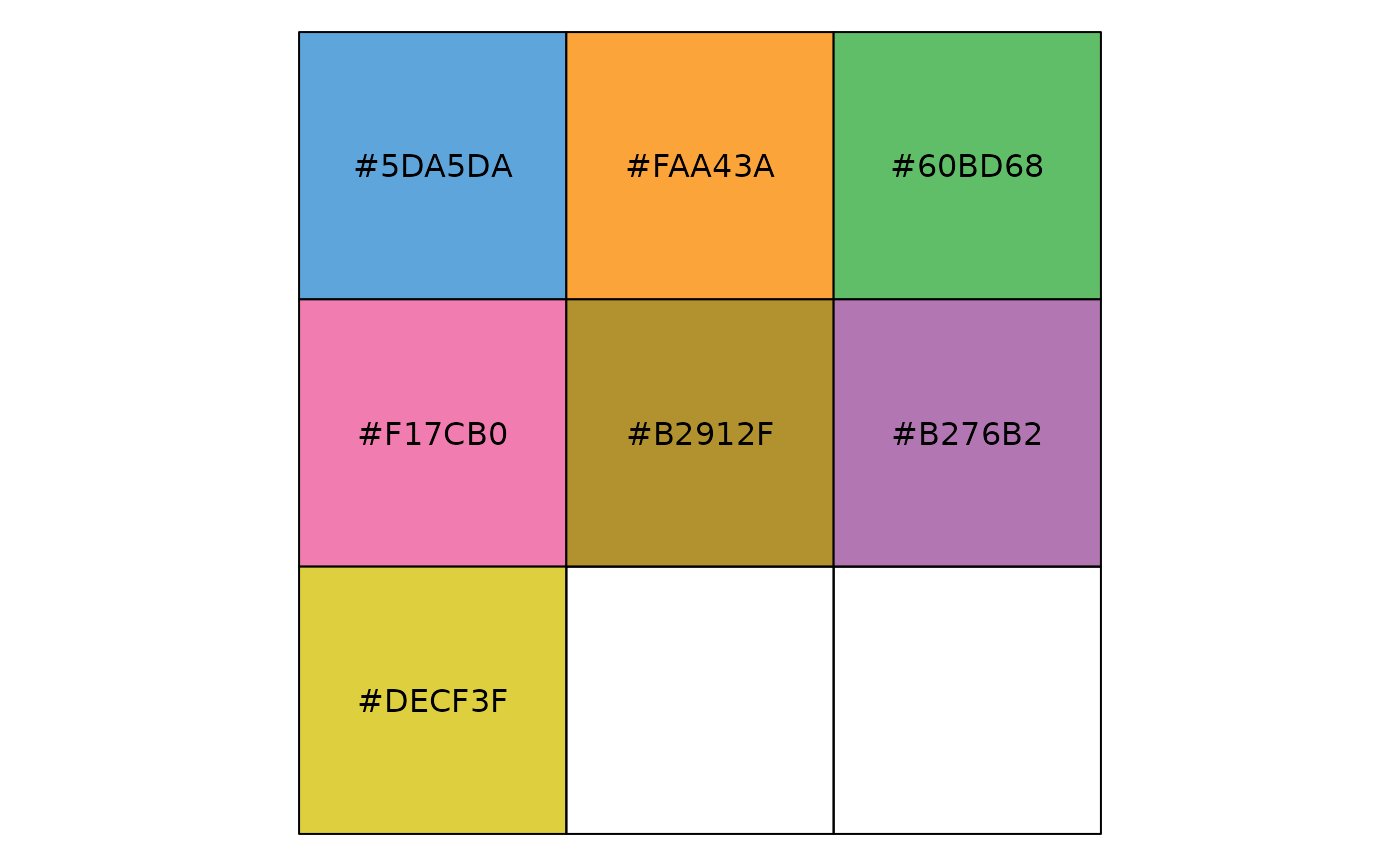
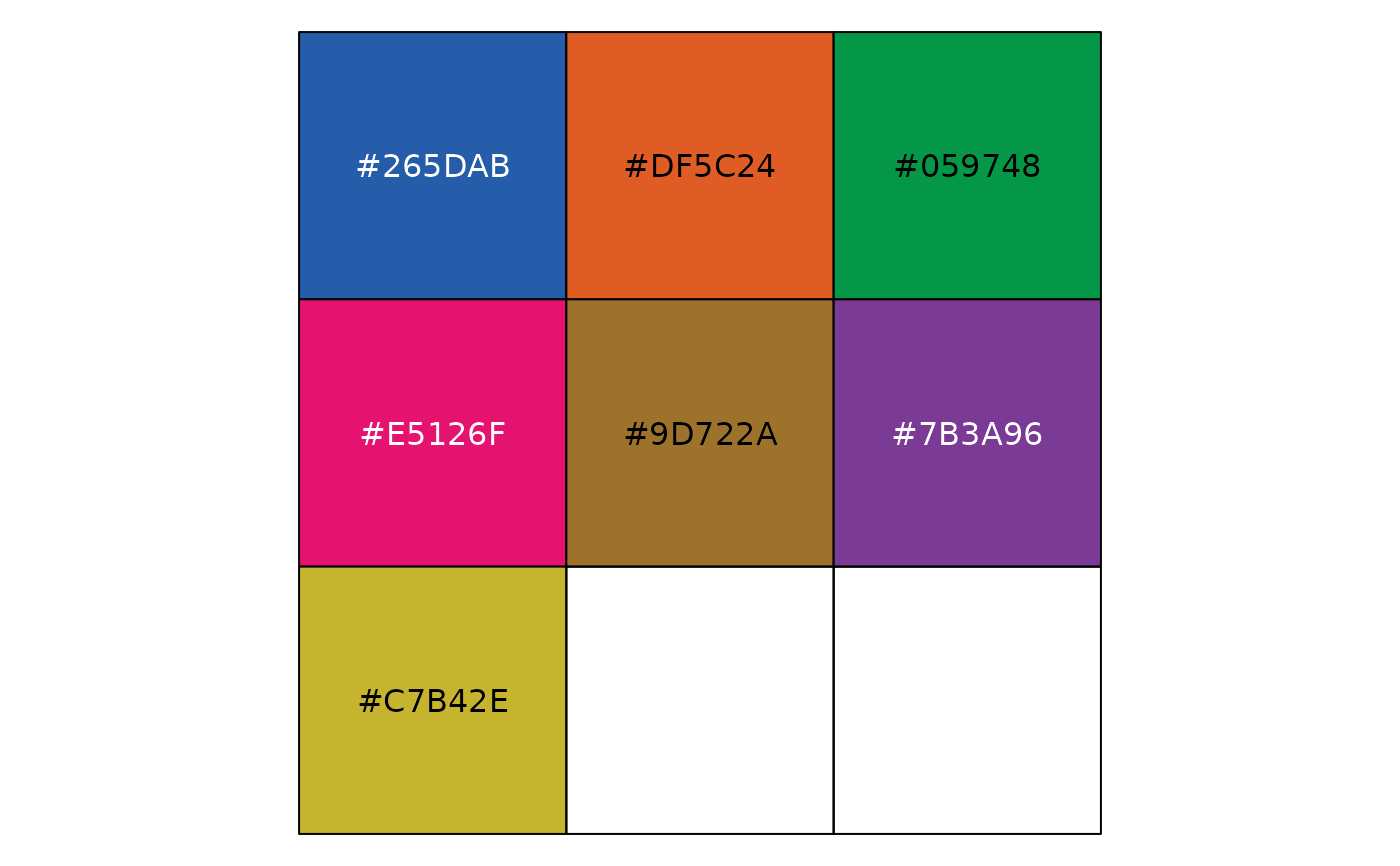
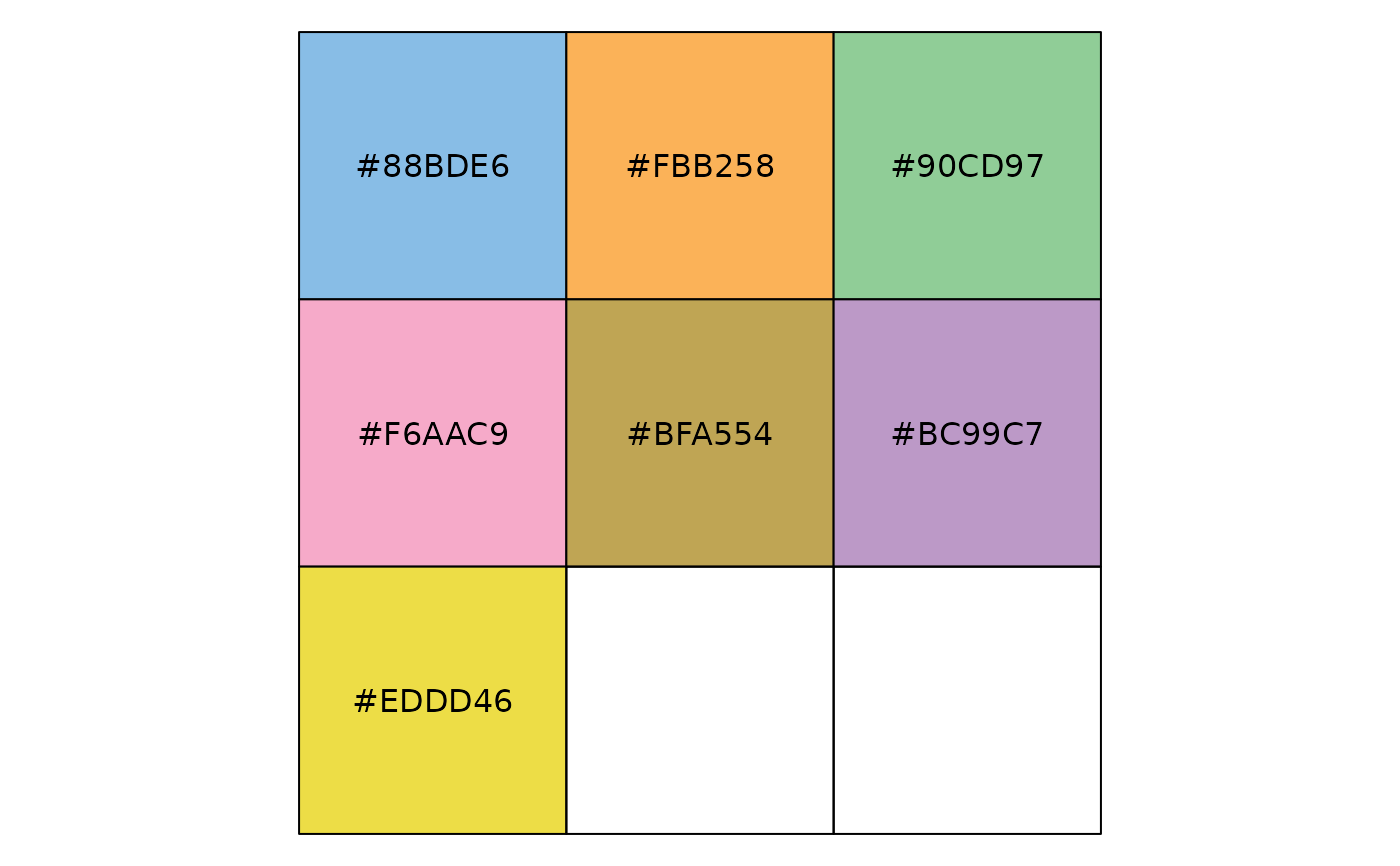
Qualitative color palettes from Stephen Few (2012)
Show Me the Numbers. There are three palettes:
Light, Medium, and Dark. Each palette comprises nine colors:
gray, blue, orange, green, pink, brown, purple, yellow, red.
For n = 1, gray is used. For n > 1, the eight non-gray
colors are used.
Details
Use the light palette for filled areas, such as bar charts. Use the medium palette for points and lines. Use the dark palette for highlighting specific points or for small and thin lines and points.
References
Few, S. (2012) Show Me the Numbers: Designing Tables and Graphs to Enlighten. 2nd edition. Analytics Press.
See also
Other colour few:
scale_colour_few()