
Theme to replicate the ugly monstrosity that was the old
gray-background Excel chart. Please never use this.
This theme should be combined with the scale_colour_excel()
color scale.
Value
An object of class ggplot2::theme().
Palettes
The theme sets excel_pal() for discrete color (line = TRUE) and fill
(line = FALSE) as the default palettes, so a plot draws in the theme's
colors without a matching scale. A scale_*() added to the plot still takes
precedence.
See also
Other themes excel:
theme_excel_new()
Examples
library(ggplot2)
# Line and scatter plot colors
p <- ggplot(mtcars) +
geom_point(aes(x = wt, y = mpg, colour = factor(gear))) +
facet_wrap(~am)
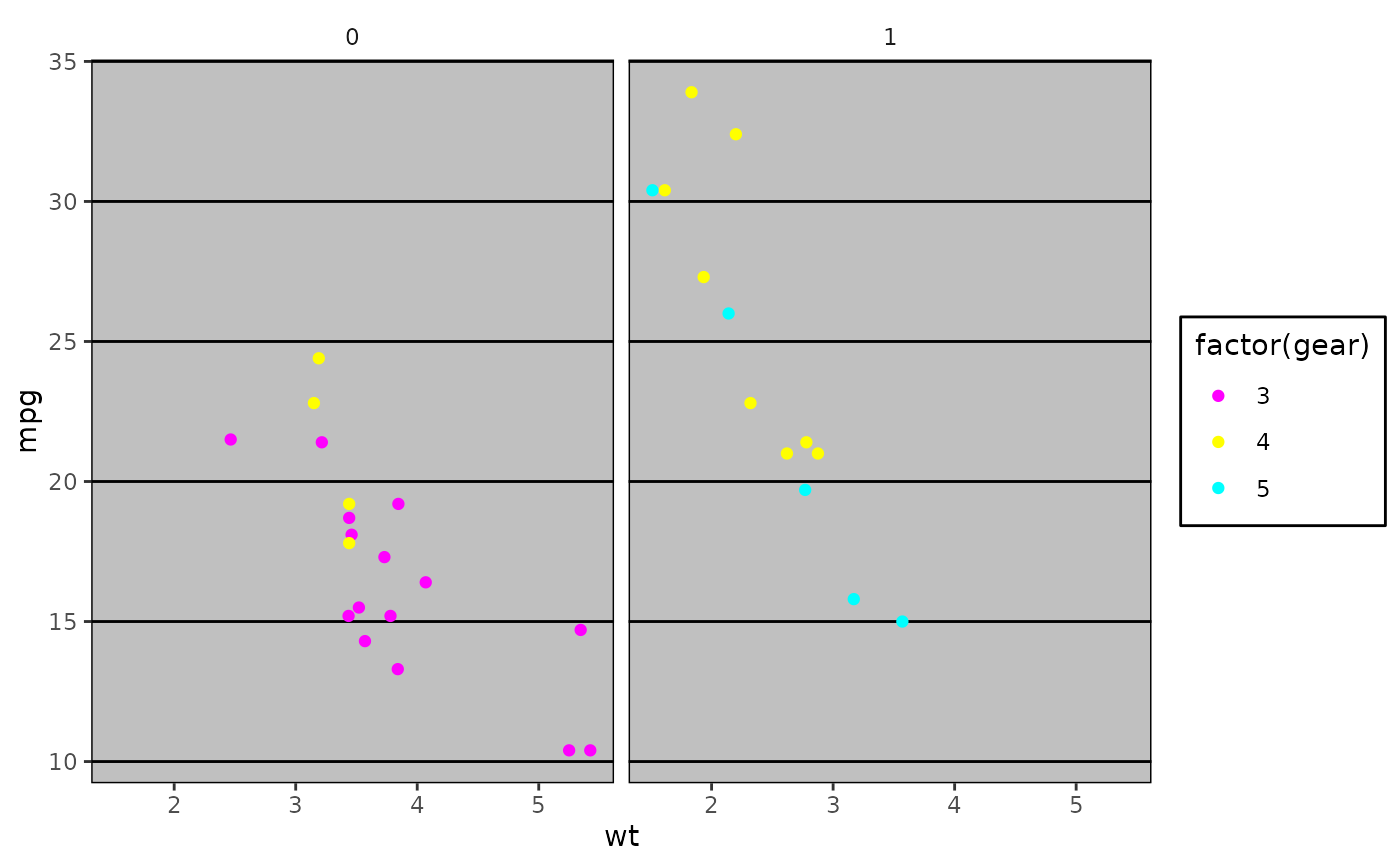
p + theme_excel() + scale_colour_excel()
 # Bar plot (area/fill) colors
ggplot(mpg, aes(x = class, fill = drv)) +
geom_bar() +
scale_fill_excel() +
theme_excel()
