Theme similar to the default look of charts in Google Docs.
Examples
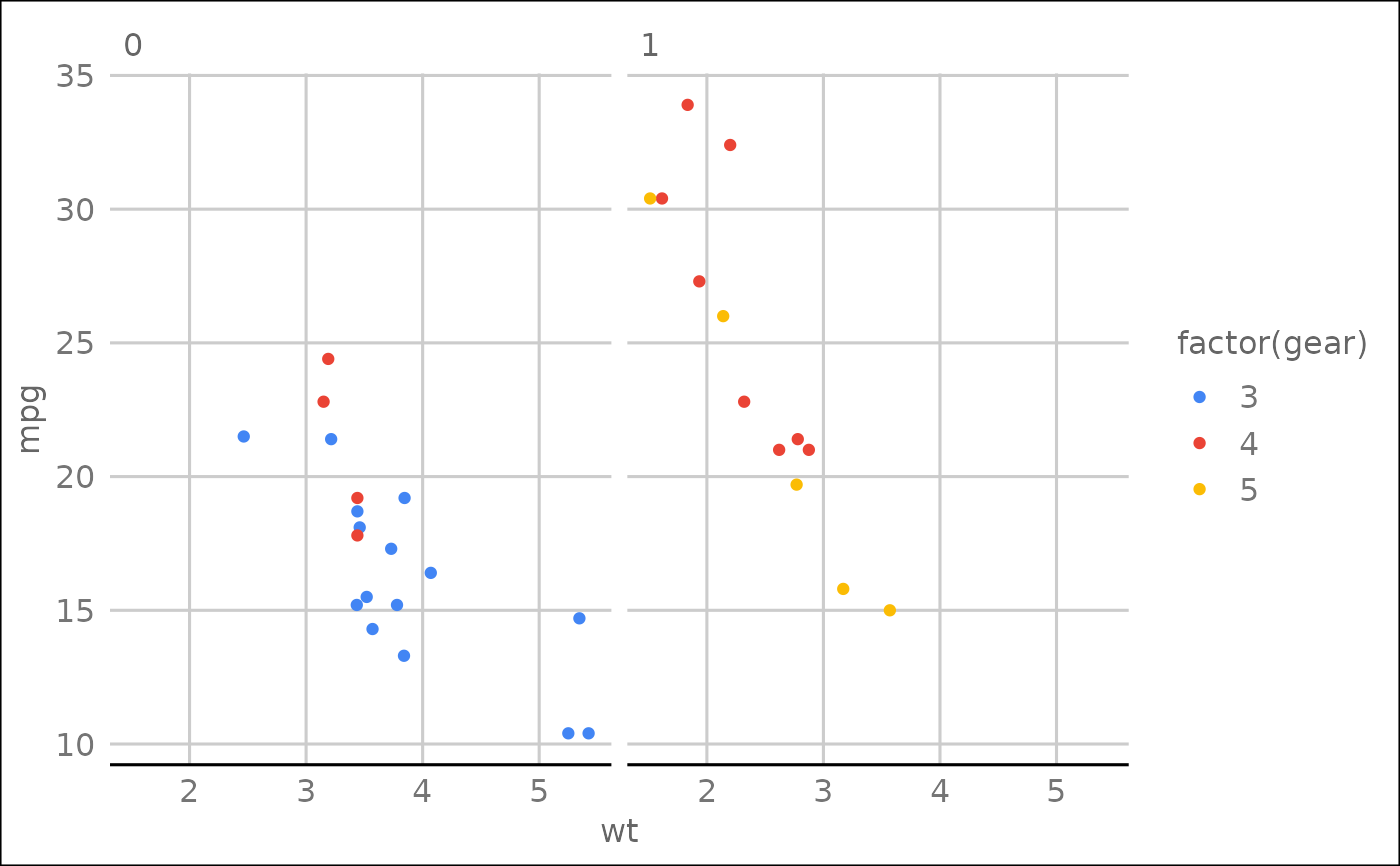
library("ggplot2")

p <- ggplot(mtcars) +
  geom_point(aes(x = wt, y = mpg, colour = factor(gear))) +
  facet_wrap(~am)
p + theme_gdocs() + scale_color_gdocs()
Theme similar to the default look of charts in Google Docs.
library("ggplot2")
p <- ggplot(mtcars) +
geom_point(aes(x = wt, y = mpg, colour = factor(gear))) +
facet_wrap(~am)
p + theme_gdocs() + scale_color_gdocs()