The pander package ships with a default theme when the 'unify plots' option is
enabled via panderOptions, which is now also available outside of pander internals, like evals,
eval.msgs or Pandoc.brew.
Usage
theme_pander(
  base_size = 12,
  base_family = "sans",
  nomargin = TRUE,
  ff = NULL,
  fc = "black",
  fs = NULL,
  gM = TRUE,
  gm = TRUE,
  gc = "grey",
  gl = "dashed",
  boxes = FALSE,
  bc = "white",
  pc = "transparent",
  lp = "right",
  axis = 1
)
Arguments
- base_size
base font size, given in pts.
- base_family
base font family
- nomargin
Whether to suppress the white space around the plot.
- ff
Font family, like
"sans".![[Deprecated]](figures/lifecycle-deprecated.svg) Use
Use base_familyinstead.- fc
Font color, as a name or hex code.
- fs
Font size (integer).
Use base_sizeinstead.- gM
Whether to draw the major grid.
- gm
Whether to draw the minor grid.
- gc
Grid color, as a name or hex code.
- gl
Grid line type (
lty).- boxes
Whether to draw a border around the plot.
- bc
Background color, as a name or hex code.
- pc
Panel background color, as a name or hex code.
- lp
Legend position.
- axis
Axis label angle, as defined by
par("las").
Examples
require("ggplot2")
if (require("pander")) {
  p <- ggplot(mtcars, aes(x = mpg, y = wt)) +
    geom_point()
  p + theme_pander()

  old_grid_color <- panderOptions("graph.grid.color")
  panderOptions("graph.grid.color", "red")
  p + theme_pander()
  panderOptions("graph.grid.color", old_grid_color)

  p <- ggplot(mtcars, aes(wt, mpg, colour = factor(cyl))) +
    geom_point()
  p + theme_pander() + scale_color_pander()

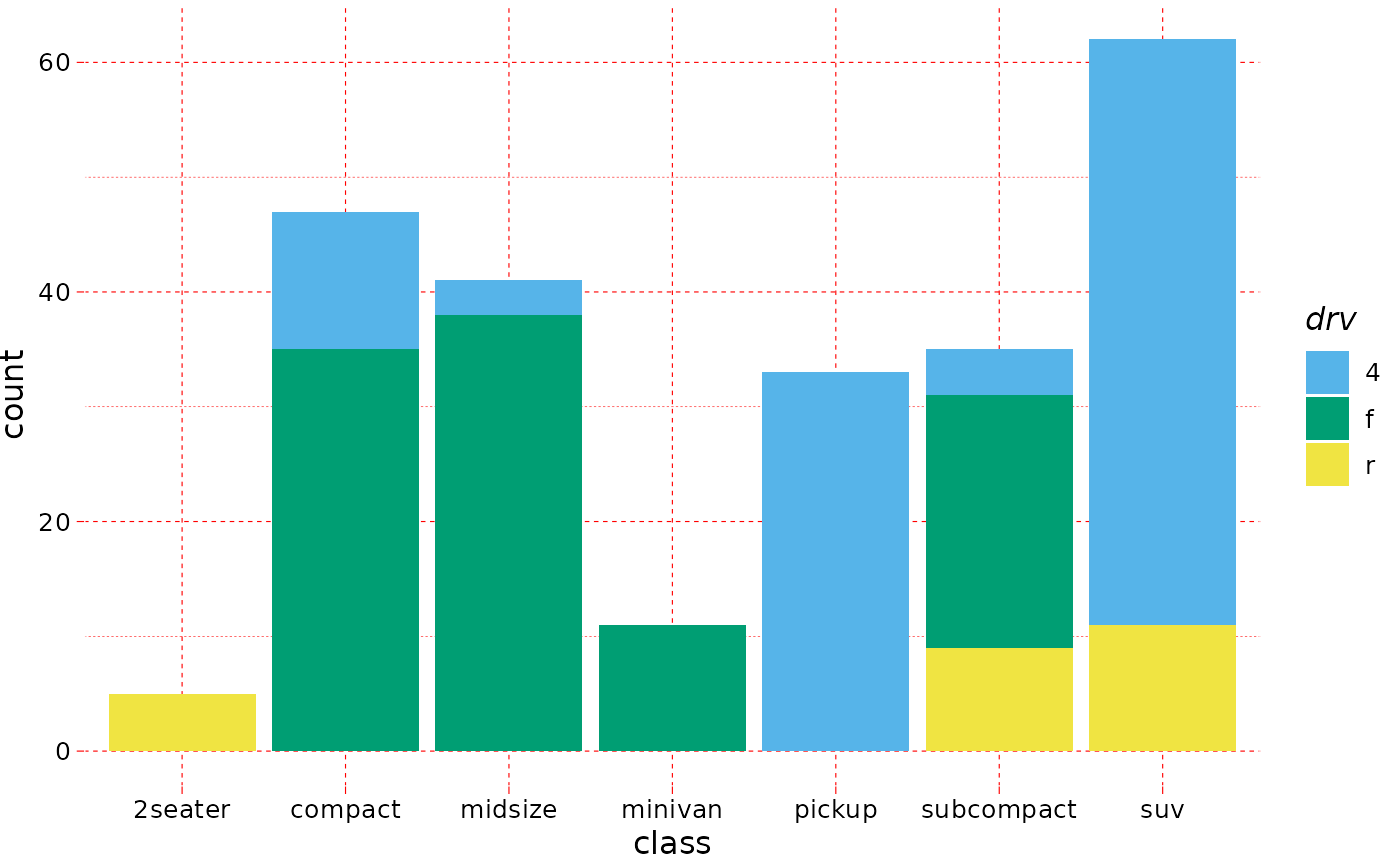
  ggplot(mpg, aes(x = class, fill = drv)) +
    geom_bar() +
    scale_fill_pander() +
    theme_pander()
}
#> Loading required package: pander