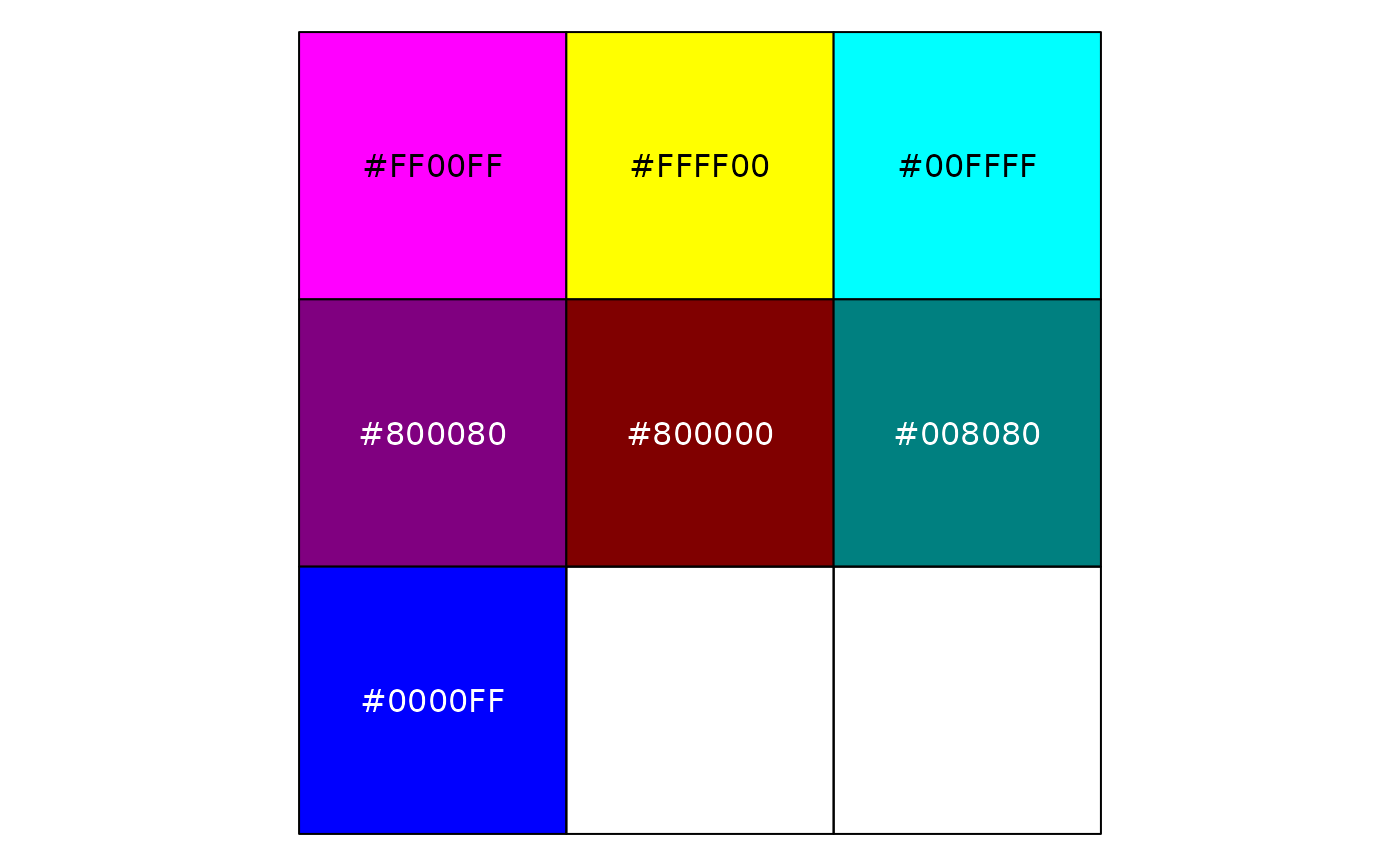
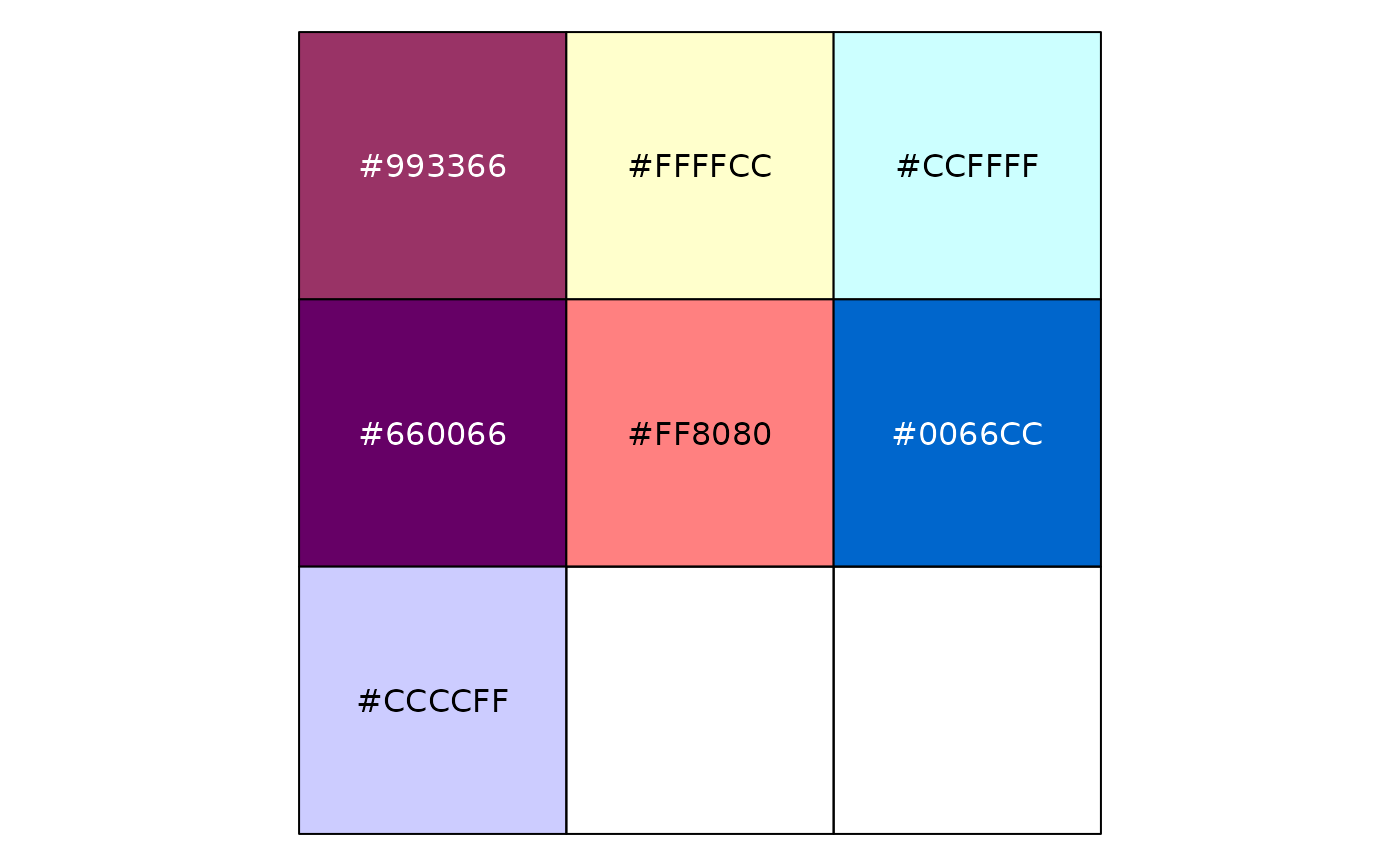
The color palettes used in Microsoft Excel 97 (and up until Excel 2007). Use this for that classic ugly look and feel. For ironic purposes only. 3D bars and pies not included. Please never use this color palette.
Value
A palette function. It takes the number of colors n and returns a character vector of n
hex colors, and can be used as the palette argument of ggplot2::discrete_scale().
See also
Other color excel:
excel_new_pal(),
scale_colour_excel_new(),
scale_fill_excel()