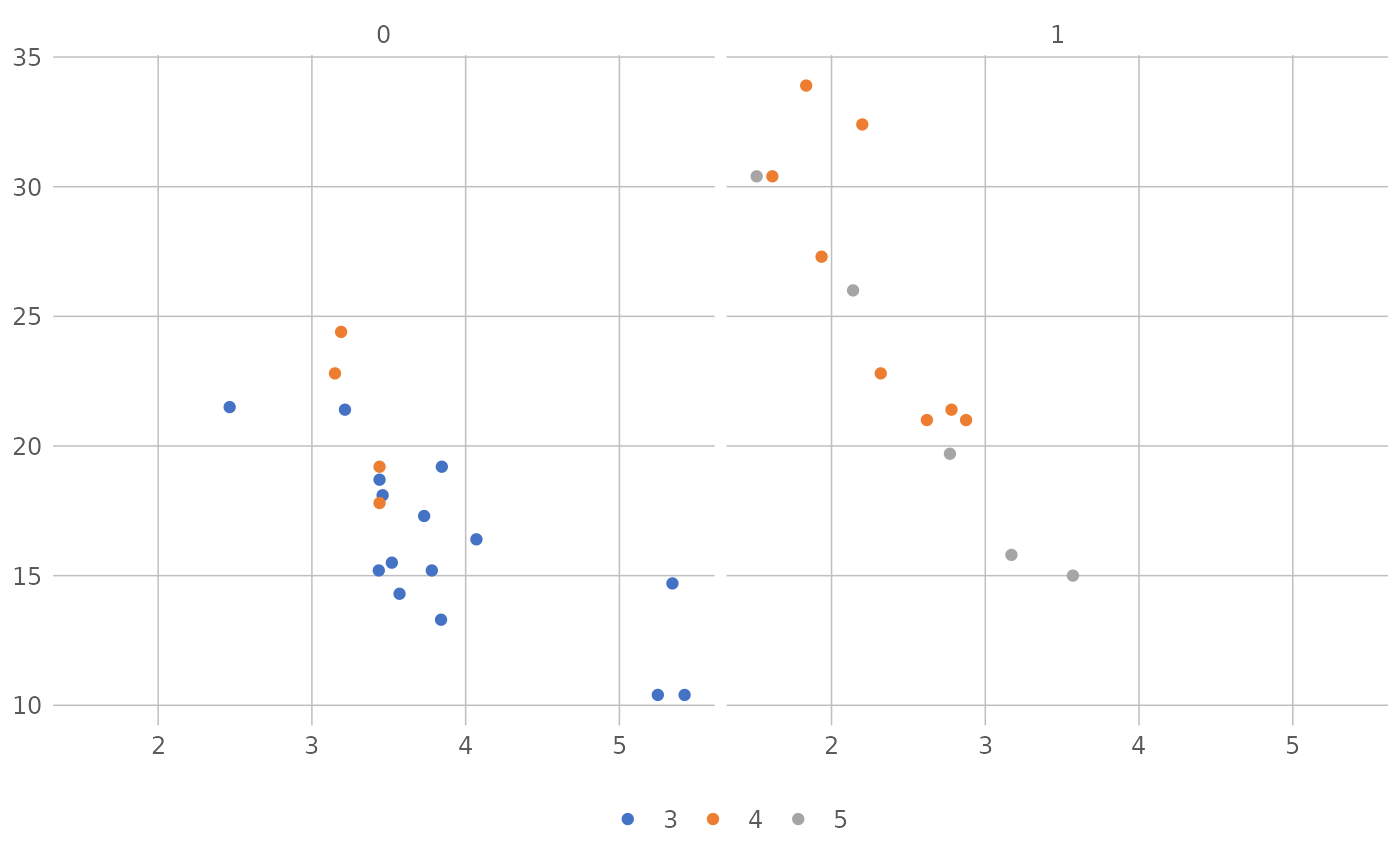
Discrete color scales used in current versions of Microsoft Office and Excel.
Usage
scale_colour_excel_new(theme = "Office Theme", ...)

scale_color_excel_new(theme = "Office Theme", ...)

scale_fill_excel_new(theme = "Office Theme", ...)
Arguments
- theme
The name of the Office theme or color theme (not to be confused with ggplot2 themes) from which to derive the color palette. Available themes include:
"Atlas","Badge","Berlin","Celestial","Crop","Depth","Droplet","Facet","Feathered","Gallery","Headlines","Integral","Ion Boardroom","Ion","Madison","Main Event","Mesh","Office Theme","Organic","Parallax","Parcel","Retrospect","Savon","Slice","Vapor Trail","View","Wisp","Wood Type","Aspect","Blue Green","Blue II","Blue Warm","Blue","Grayscale","Green Yellow","Green","Marquee","Median","Office 2007-2010","Orange Red","Orange","Paper","Red Orange","Red Violet","Red","Slipstream","Violet II","Violet","Yellow Orange","Yellow"- ...
Arguments passed on to
discrete_scalebreaksOne of:
limitsOne of:
NULLto use the default scale valuesA character vector that defines possible values of the scale and their order
A function that accepts the existing (automatic) values and returns new ones. Also accepts rlang lambda function notation.
dropShould unused factor levels be omitted from the scale? The default,
TRUE, uses the levels that appear in the data;FALSEincludes the levels in the factor. Please note that to display every level in a legend, the layer should useshow.legend = TRUE.na.translateUnlike continuous scales, discrete scales can easily show missing values, and do so by default. If you want to remove missing values from a discrete scale, specify
na.translate = FALSE.minor_breaksOne of:
NULLfor no minor breakswaiver()for the default breaks (none for discrete, one minor break between each major break for continuous)A numeric vector of positions
A function that given the limits returns a vector of minor breaks. Also accepts rlang lambda function notation. When the function has two arguments, it will be given the limits and major break positions.
labelsOne of the options below. Please note that when
labelsis a vector, it is highly recommended to also set thebreaksargument as a vector to protect against unintended mismatches.NULLfor no labelswaiver()for the default labels computed by the transformation objectA character vector giving labels (must be same length as
breaks)An expression vector (must be the same length as breaks). See ?plotmath for details.
A function that takes the breaks as input and returns labels as output. Also accepts rlang lambda function notation.
guideA function used to create a guide or its name. See
guides()for more information.callThe
callused to construct the scale for reporting messages.superThe super class to use for the constructed scale
See also
Other colour excel:
excel_new_pal(),
excel_pal(),
scale_fill_excel()
Examples
library("ggplot2")

p <- ggplot(mtcars) +
  geom_point(aes(x = wt, y = mpg, colour = factor(gear))) +
  facet_wrap(~am)
p + theme_excel_new() + scale_colour_excel_new()