The "equal lightness colour scales" of The Economist visual
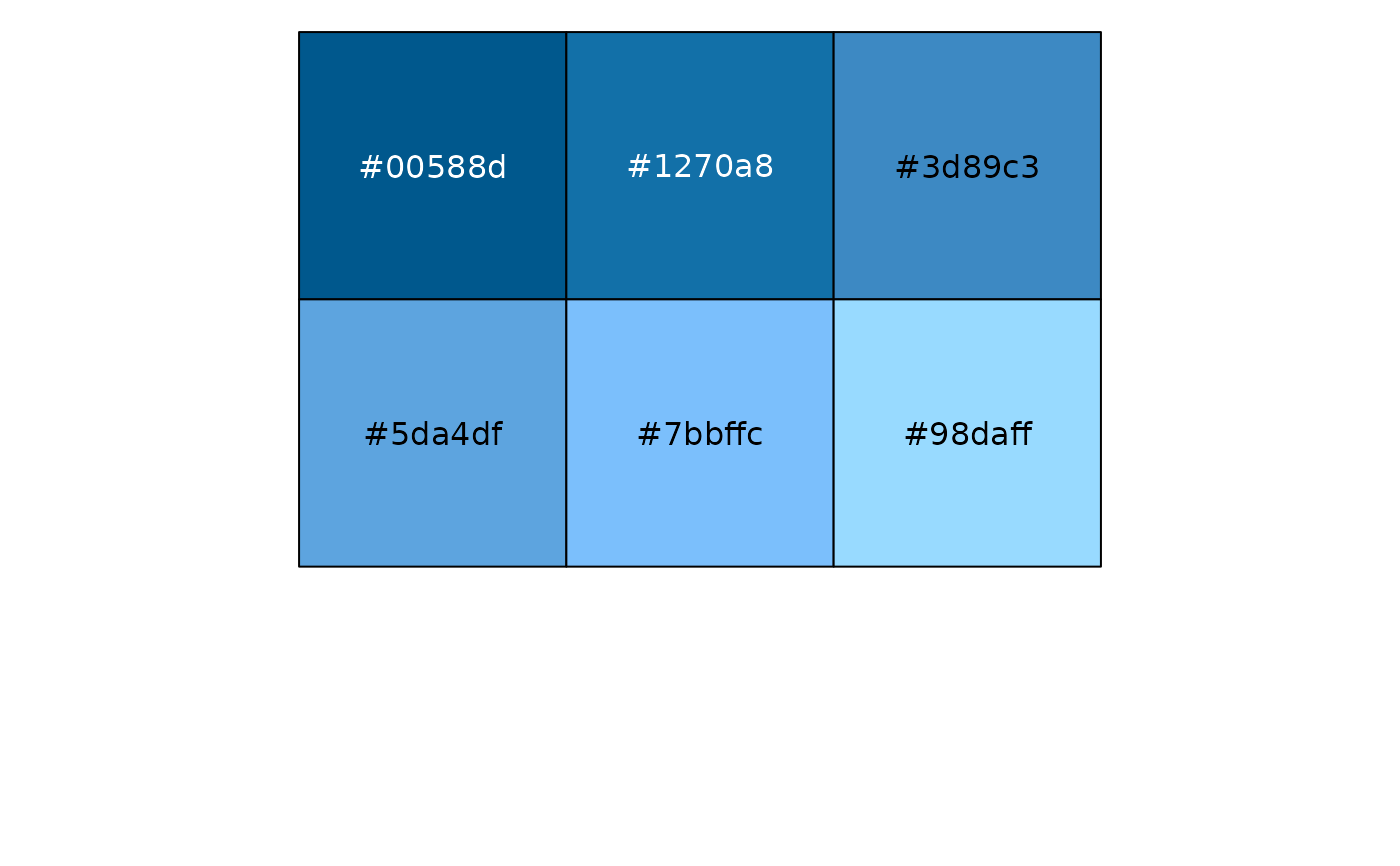
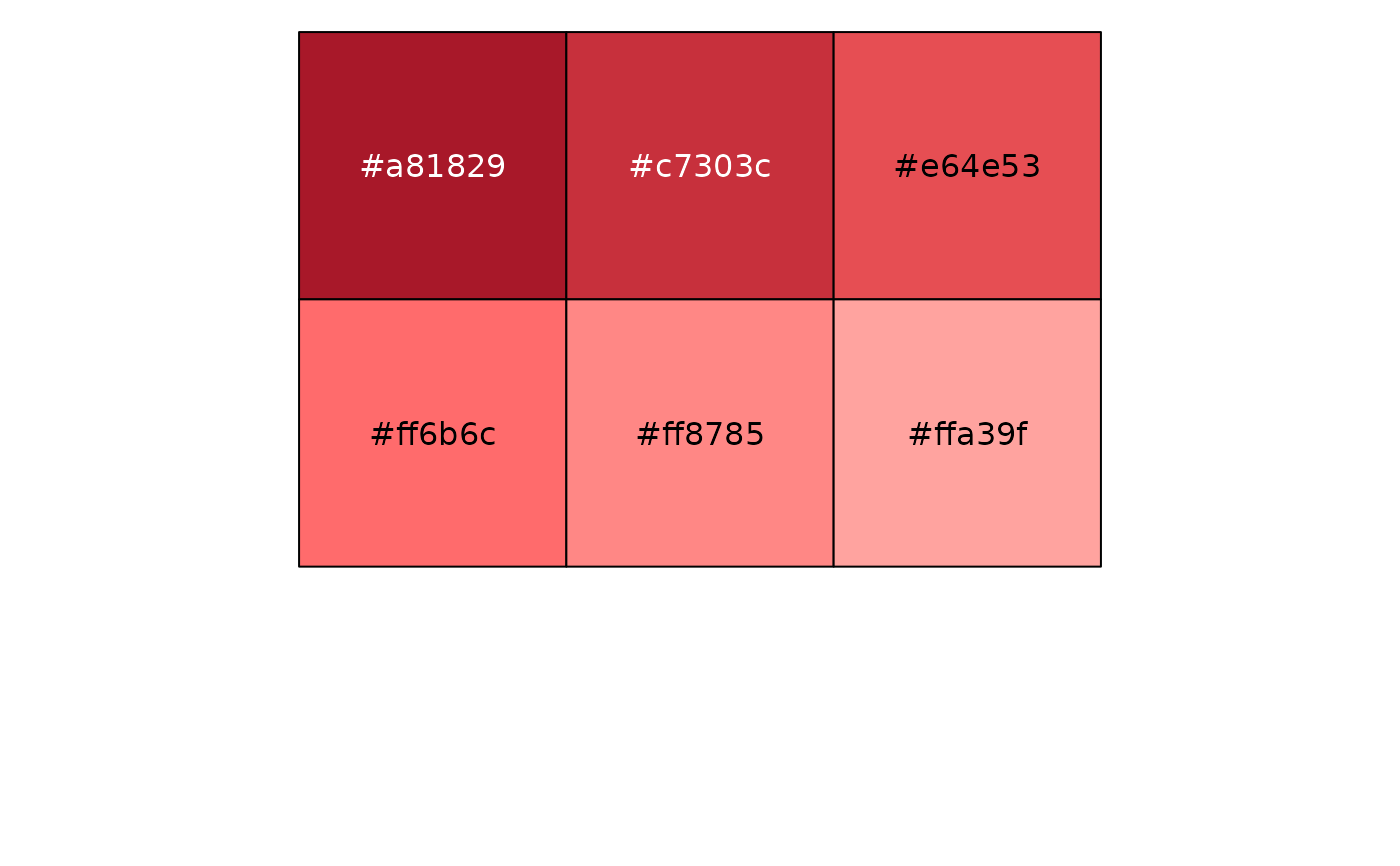
styleguide (v1.2, 4 May 2017): six ordered steps for each of nine hues,
running darkest to lightest. Use them for ordered data. They come from
the paper's 2017 chart design, not the classic design of
economist_pal() and theme_economist().
Value
economist_seq_pal() returns a palette function that takes the number of colors n and
returns the first n of the six hex colors for hue, for use with
ggplot2::discrete_scale(). economist_gradient_pal() returns a palette function that
takes a numeric vector x of values between 0 and 1 and returns hex colors interpolated between
those steps, for use with ggplot2::continuous_scale().
Details
economist_seq_pal() returns the six steps themselves, for
discrete ordered data. economist_gradient_pal() interpolates
between them, for continuous data.
See also
Other color economist:
economist_pal(),
scale_colour_economist(),
scale_colour_economist_c()