If you find any typos, errors, or places where the text may be improved, please let me know. The best ways to provide feedback are by GitHub or hypothes.is annotations.
Opening an issue or submitting a pull request on GitHub
Adding an annotation using hypothes.is.
To add an annotation, select some text and then click the
on the pop-up menu.
To see the annotations of others, click the
in the upper right-hand corner of the page.
25 Many models
25.1 Introduction
25.2 gapminder
Exercise 25.2.1
A linear trend seems to be slightly too simple for the overall trend. Can you do better with a quadratic polynomial? How can you interpret the coefficients of the quadratic? Hint you might want to transform year so that it has mean zero.)
The following code replicates the analysis in the chapter but replaces the function country_model() with a regression that includes the year squared.
country_model <- function(df) {
  lm(lifeExp ~ poly(year - median(year), 2), data = df)
}

by_country <- gapminder %>%
  group_by(country, continent) %>%
  nest()

by_country <- by_country %>%
  mutate(model = map(data, country_model))
by_country <- by_country %>%
mutate(
resids = map2(data, model, add_residuals)
)
by_country
#> # A tibble: 142 x 5
#> # Groups: country, continent [142]
#> country continent data model resids
#> <fct> <fct> <list> <list> <list>
#> 1 Afghanistan Asia <tibble [12 × 4]> <lm> <tibble [12 × 5]>
#> 2 Albania Europe <tibble [12 × 4]> <lm> <tibble [12 × 5]>
#> 3 Algeria Africa <tibble [12 × 4]> <lm> <tibble [12 × 5]>
#> 4 Angola Africa <tibble [12 × 4]> <lm> <tibble [12 × 5]>
#> 5 Argentina Americas <tibble [12 × 4]> <lm> <tibble [12 × 5]>
#> 6 Australia Oceania <tibble [12 × 4]> <lm> <tibble [12 × 5]>
#> # … with 136 more rowsunnest(by_country, resids) %>%
ggplot(aes(year, resid)) +
geom_line(aes(group = country), alpha = 1 / 3) +
geom_smooth(se = FALSE)
#> `geom_smooth()` using method = 'gam' and formula 'y ~ s(x, bs = "cs")'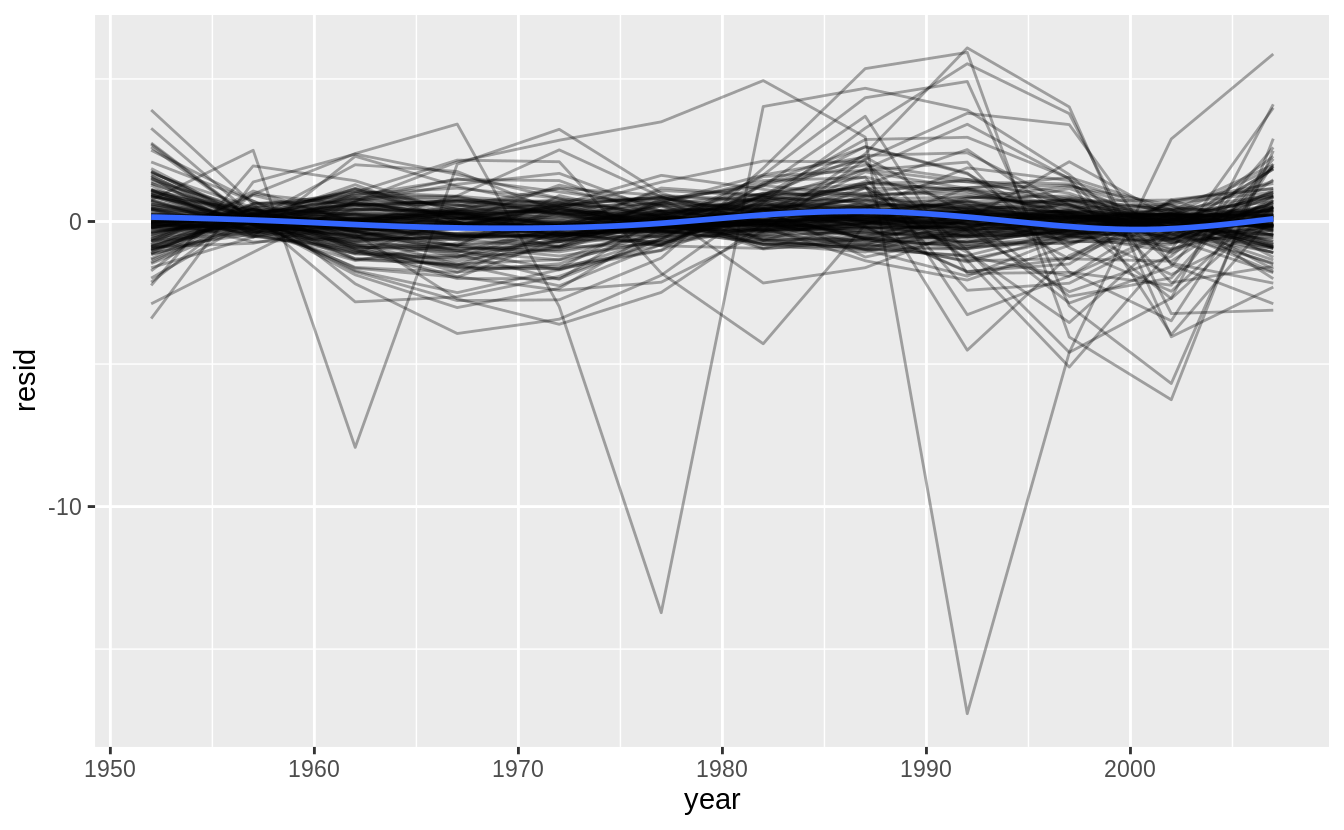
by_country %>%
  mutate(glance = map(model, broom::glance)) %>%
  unnest(glance, .drop = TRUE) %>%
  ggplot(aes(continent, r.squared)) +
  geom_jitter(width = 0.5)
#> Warning: The `.drop` argument of `unnest()` is deprecated as of tidyr 1.0.0.
#> All list-columns are now preserved.
#> This warning is displayed once every 8 hours.
#> Call `lifecycle::last_warnings()` to see where this warning was generated.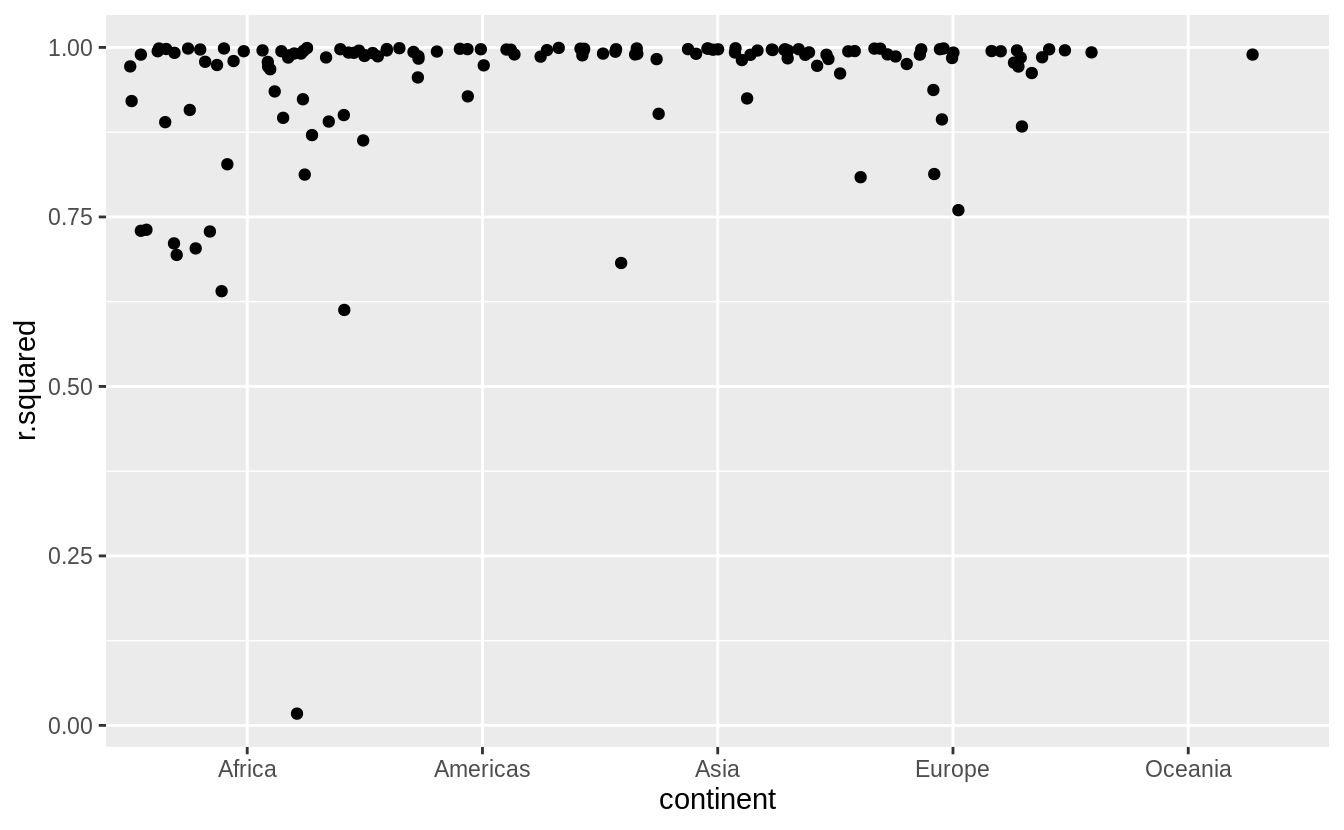
Exercise 25.2.2
Explore other methods for visualizing the distribution of \(R^2\) per continent. You might want to try the ggbeeswarm package, which provides similar methods for avoiding overlaps as jitter, but uses deterministic methods.
See exercise 7.5.1.1.6 for more on ggbeeswarm
library("ggbeeswarm")
by_country %>%
  mutate(glance = map(model, broom::glance)) %>%
  unnest(glance, .drop = TRUE) %>%
  ggplot(aes(continent, r.squared)) +
  geom_beeswarm()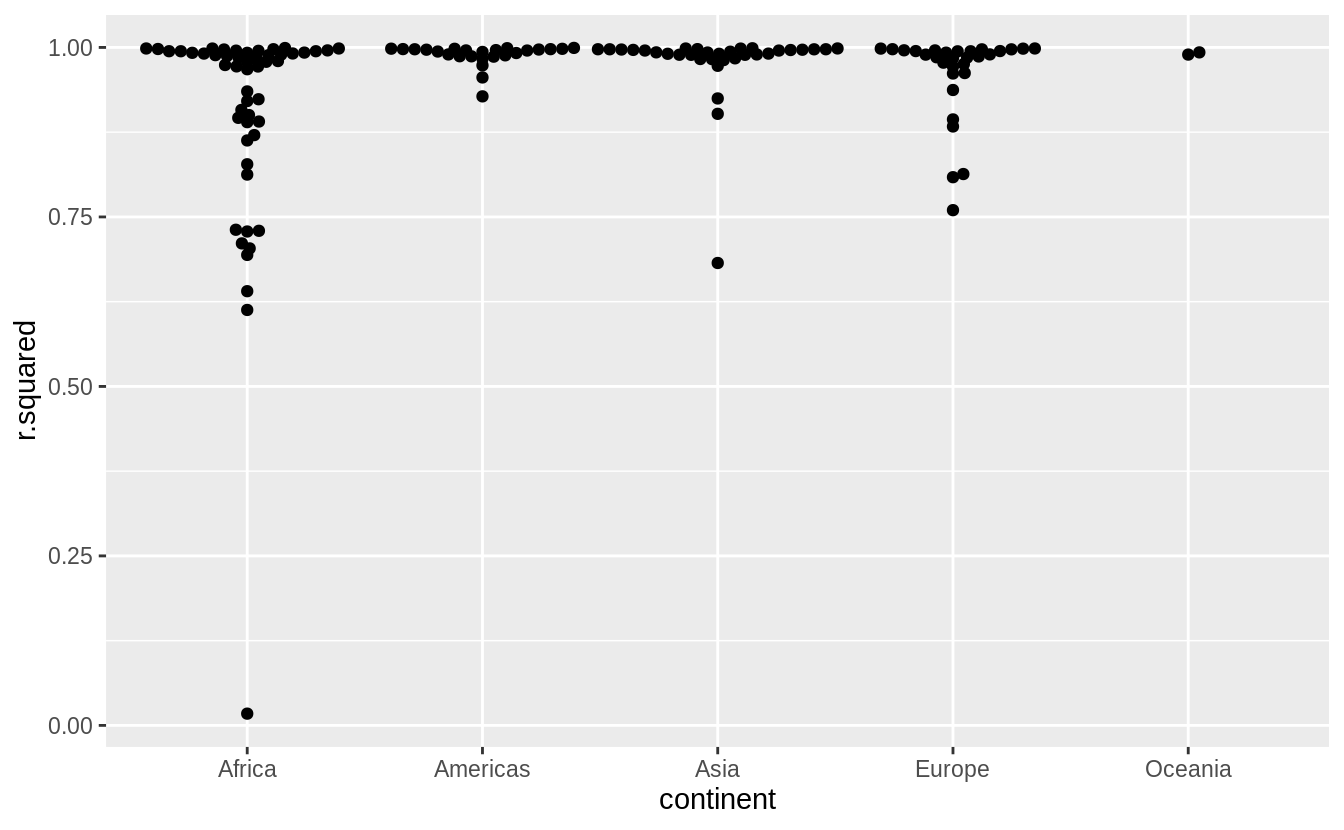
Exercise 25.2.3
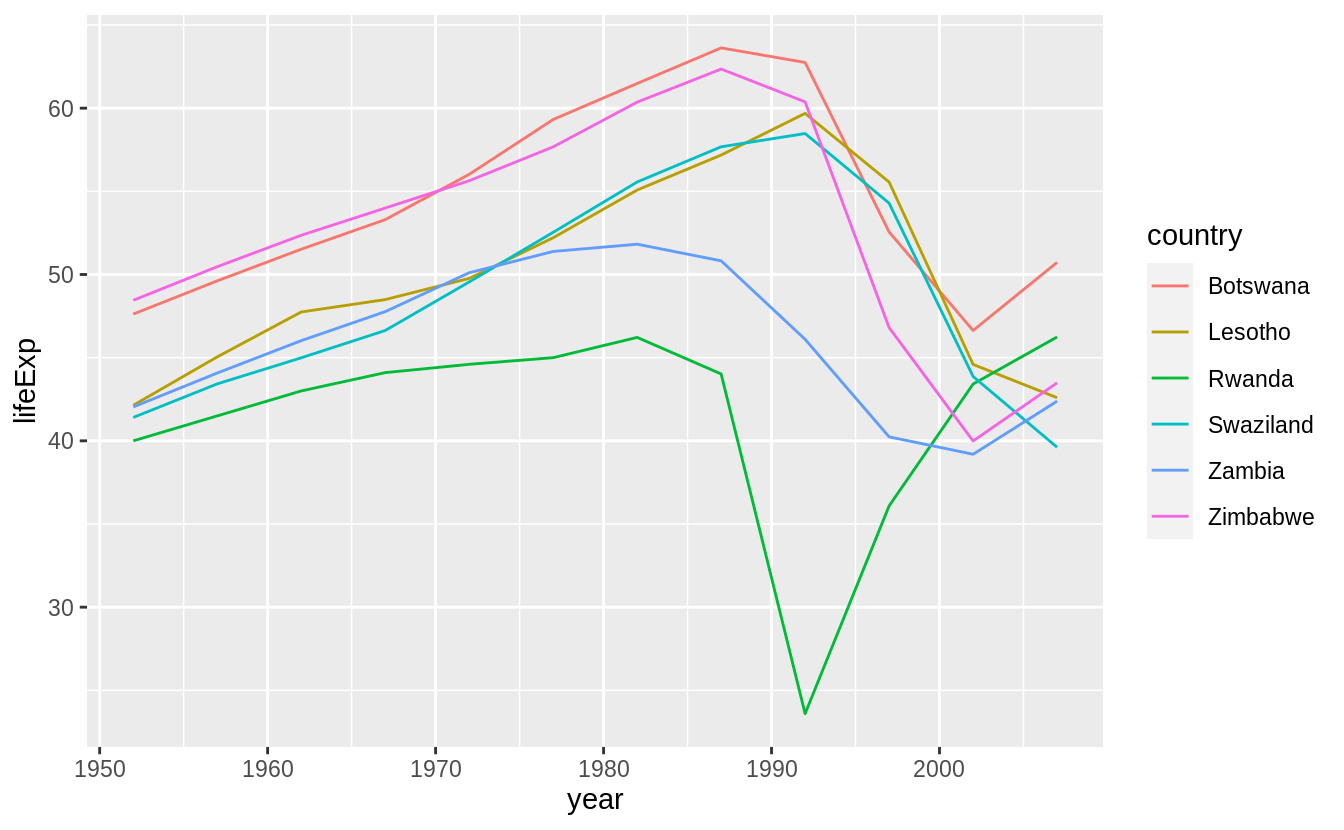
To create the last plot (showing the data for the countries with the worst model fits),
we needed two steps:
we created a data frame with one row per country
and then semi-joined it to the original dataset.
It’s possible to avoid this join if we use unnest() instead of unnest(.drop = TRUE).
How?
25.3 List-columns
25.4 Creating list-columns
Exercise 25.4.1
List all the functions that you can think of that take a atomic vector and return a list.
Many functions in the stringr package take a character vector as input and return a list.
str_split(sentences[1:3], " ")
#> [[1]]
#> [1] "The"     "birch"   "canoe"   "slid"    "on"      "the"     "smooth"
#> [8] "planks."
#>
#> [[2]]
#> [1] "Glue"        "the"         "sheet"       "to"          "the"
#> [6] "dark"        "blue"        "background."
#>
#> [[3]]
#> [1] "It's"  "easy"  "to"    "tell"  "the"   "depth" "of"    "a"     "well."
str_match_all(c("abc", "aa", "aabaa", "abbbc"), "a+")
#> [[1]]
#>      [,1]
#> [1,] "a"
#>
#> [[2]]
#>      [,1]
#> [1,] "aa"
#>
#> [[3]]
#>      [,1]
#> [1,] "aa"
#> [2,] "aa"
#>
#> [[4]]
#>      [,1]
#> [1,] "a"
The map() function takes a vector and always returns a list.
Exercise 25.4.2
Brainstorm useful summary functions that, like quantile(), return multiple values.
Some examples of summary functions that return multiple values are the following.
Exercise 25.4.3
What’s missing in the following data frame?
How does quantile() return that missing piece?
Why isn’t that helpful here?
mtcars %>%
  group_by(cyl) %>%
  summarise(q = list(quantile(mpg))) %>%
  unnest()
#> `summarise()` ungrouping output (override with `.groups` argument)
#> Warning: `cols` is now required when using unnest().
#> Please use `cols = c(q)`
#> # A tibble: 15 x 2
#>     cyl     q
#>   <dbl> <dbl>
#> 1     4  21.4
#> 2     4  22.8
#> 3     4  26
#> 4     4  30.4
#> 5     4  33.9
#> 6     6  17.8
#> # … with 9 more rows
The particular quantiles of the values are missing, e.g. 0%, 25%, 50%, 75%, 100%. quantile() returns these in the names of the vector.
Since the unnest function drops the names of the vector, they aren’t useful here.
Exercise 25.4.4
What does this code do? Why might might it be useful?
mtcars %>%
  group_by(cyl) %>%
  summarise_each(funs(list))
#> Warning: `summarise_each_()` is deprecated as of dplyr 0.7.0.
#> Please use `across()` instead.
#> This warning is displayed once every 8 hours.
#> Call `lifecycle::last_warnings()` to see where this warning was generated.
#> Warning: `funs()` is deprecated as of dplyr 0.8.0.
#> Please use a list of either functions or lambdas:
#>
#> # Simple named list:
#> list(mean = mean, median = median)
#>
#> # Auto named with `tibble::lst()`:
#> tibble::lst(mean, median)
#>
#> # Using lambdas
#> list(~ mean(., trim = .2), ~ median(., na.rm = TRUE))
#> This warning is displayed once every 8 hours.
#> Call `lifecycle::last_warnings()` to see where this warning was generated.
#> # A tibble: 3 x 11
#> cyl mpg disp hp drat wt qsec vs am gear carb
#> <dbl> <list> <list> <list> <list> <list> <list> <list> <list> <list> <list>
#> 1 4 <dbl [… <dbl [… <dbl [… <dbl … <dbl … <dbl … <dbl … <dbl … <dbl … <dbl …
#> 2 6 <dbl [… <dbl [… <dbl [… <dbl … <dbl … <dbl … <dbl … <dbl … <dbl … <dbl …
#> 3 8 <dbl [… <dbl [… <dbl [… <dbl … <dbl … <dbl … <dbl … <dbl … <dbl … <dbl …It creates a data frame in which each row corresponds to a value of cyl,
and each observation for each column (other than cyl) is a vector of all the values of that column for that value of cyl.
It seems like it should be useful to have all the observations of each variable for each group, but off the top of my head, I can’t think of a specific use for this.
But, it seems that it may do many things that dplyr::do does.
25.5 Simplifying list-columns
Exercise 25.5.1
Why might the lengths() function be useful for creating atomic vector columns from list-columns?
The lengths() function returns the lengths of each element in a list.
It could be useful for testing whether all elements in a list-column are the same length.
You could get the maximum length to determine how many atomic vector columns to create.
It is also a replacement for something like map_int(x, length) or sapply(x, length).
Exercise 25.5.2
List the most common types of vector found in a data frame. What makes lists different?
The common types of vectors in data frames are:
logicalnumericintegercharacterfactor
All of the common types of vectors in data frames are atomic. Lists are not atomic since they can contain other lists and other vectors.