If you find any typos, errors, or places where the text may be improved, please let me know. The best ways to provide feedback are by GitHub or hypothes.is annotations.
Opening an issue or submitting a pull request on GitHub
Adding an annotation using hypothes.is.
To add an annotation, select some text and then click the
on the pop-up menu.
To see the annotations of others, click the
in the upper right-hand corner of the page.
27 R Markdown
27.1 Introduction
27.2 R Markdown basics
Exercise 27.2.1
Create a new notebook using File > New File > R Notebook. Read the instructions. Practice running the chunks. Verify that you can modify the code, re-run it, and see modified output.
This exercise is left to the reader.
Exercise 27.2.2
Create a new R Markdown document with File > New File > R Markdown …. Knit it by clicking the appropriate button. Knit it by using the appropriate keyboard short cut. Verify that you can modify the input and see the output update.
This exercise is mostly left to the reader.
Recall that the keyboard shortcut to knit a file is Cmd/Ctrl + Alt + K.
Exercise 27.2.3
Compare and contrast the R notebook and R markdown files you created above. How are the outputs similar? How are they different? How are the inputs similar? How are they different? What happens if you copy the YAML header from one to the other?
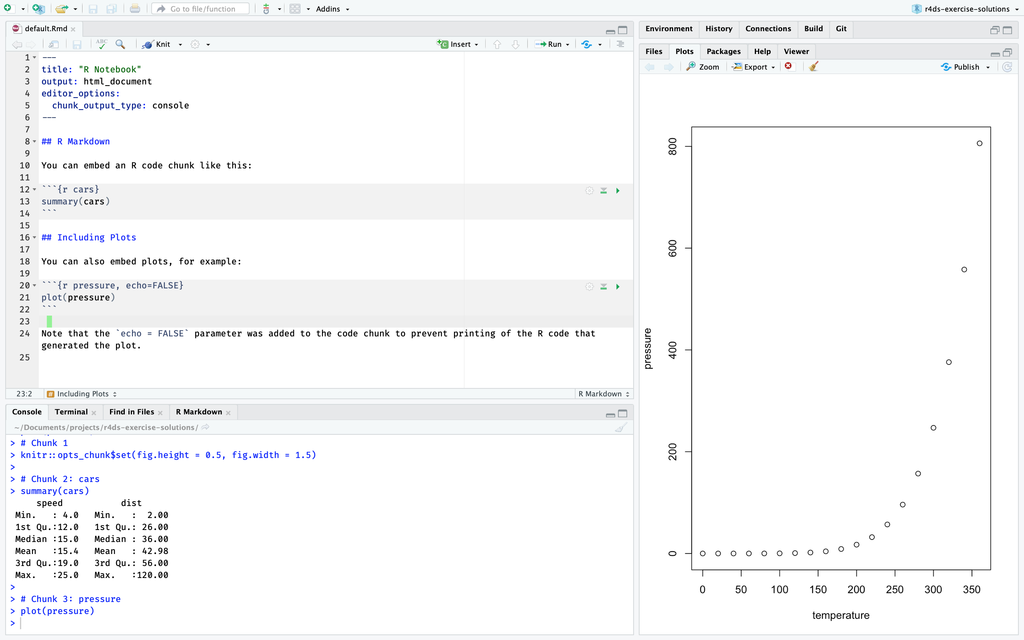
R notebook files show the output of code chunks inside the editor, while hiding the console, when they are edited in RStudio.
This contrasts with R markdown files, which show their output inside the console, and do not show output inside the editor.
This makes R notebook documents appealing for interactive exploration.
In this R markdown file, the plot is displayed in the “Plot” tab, while the output of summary() is displayed in the tab.
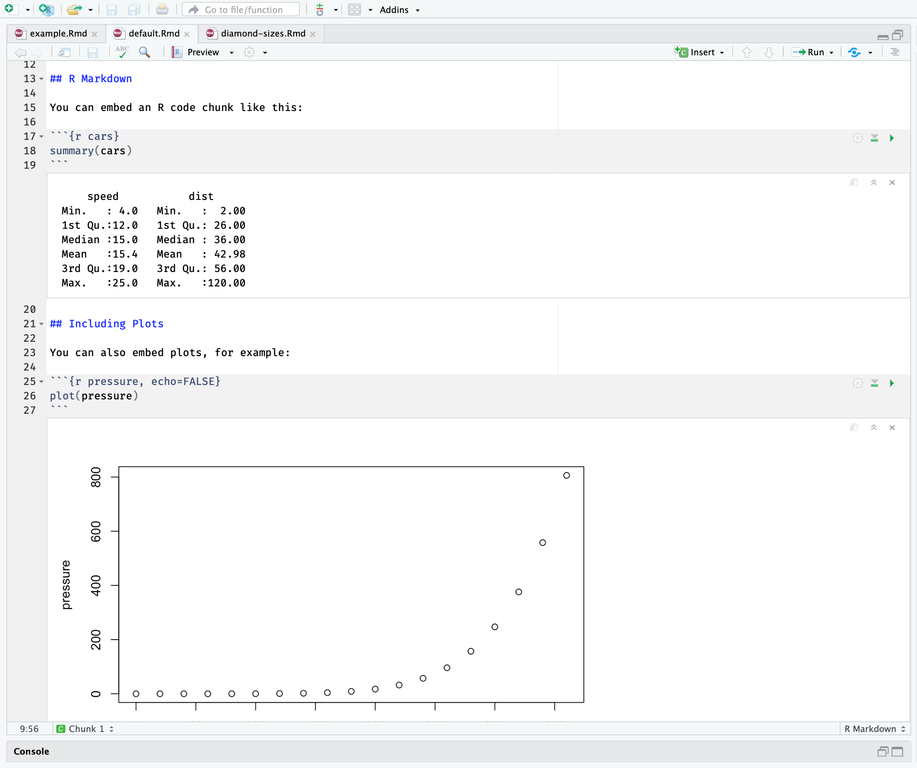
 However, when this same file is converted to a R notebook, the plot and
 summary() output are displayed in the “Editor” below the chunk of code which created them.
Both R notebooks and R markdown files and can be knit to produce HTML output.
R markdown files can be knit to a variety of formats including HTML, PDF, and DOCX.
However, R notebooks can only be knit to HTML files, which are given the extension .nb.html.
However, unlike R markdown files knit to HTML, the HTML output of an R notebook includes copy of the original .Rmd source.
If a .nb.html file is opened in RStudio, the source of the .Rmd file can be extracted and edited.
In contrast, there is no way to recover the original source of an R markdown file from its output, except through the parts that are displayed in the output itself.
R markdown files and R notebooks differ in the value of output in their YAML headers.
The YAML header for the R notebook will have the line,
---
ouptut: html_notebook
---
For example, this is a R notebook,
---
title: "Diamond sizes"
date: 2016-08-25
output: html_notebook
---

Text of the document.
The YAML header for the R markdown file will have the line,
ouptut: html_documentFor example, this is a R markdown file.
---
title: "Diamond sizes"
date: 2016-08-25
output: html_document
---

Text of the document.
Copying the YAML header from an R notebook to a R markdown file changes it to an R notebook, and vice-versa.
More specifically, an .Rmd file can be changed to R markdown file or R notebook by changing the value of the output key in the header.
The RStudio IDE and the rmarkdown package both use the YAML header of an .Rmd file to determine the document-type of the file.
For more information on R markdown notebooks see the following sources:
- R Markdown: The Definitive Guide section), Chapter Notebook
- Difference between R MarkDown and R NoteBook StackOverflow thread.
Exercise 27.2.4
Create one new R Markdown document for each of the three built-in formats: HTML, PDF and Word. Knit each of the three documents. How does the output differ? How does the input differ? (You may need to install LaTeX in order to build the PDF output — RStudio will prompt you if this is necessary.)
They produce different outputs, both in the final documents and intermediate
files (notably the type of plots produced). The only difference in the inputs
is the value of output in the YAML header.
The following .Rmd would be knit to HTML.
---
title: "Diamond sizes"
date: 2016-08-25
output: html_document
---

Text of the document.
If the value of the output key is changed to word_document, knitting the file will create a Word document (DOCX).
---
title: "Diamond sizes"
date: 2016-08-25
output: word_document
---

Text of the document.
Similarly, if the value of the output key is changed to pdf_document, knitting the file will create a PDF.
---
title: "Diamond sizes"
date: 2016-08-25
output: pdf_document
---
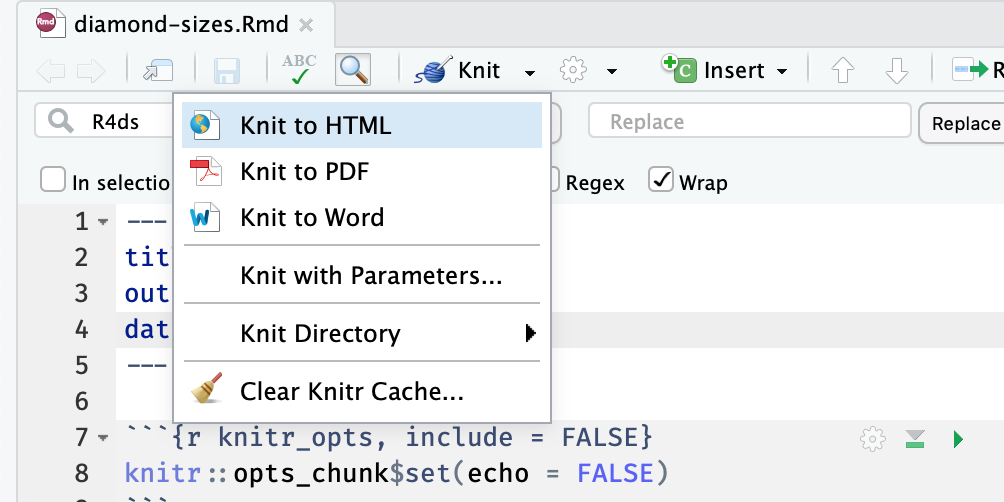
Text of the document.If you click on the Knit menu button and then on one of Knit to HTML, Knit to PDF, or Knit to Word,
you will see that the value of the output key will change to html_document, pdf_document, or word_document, respectively.
You will see that the value of output will look a little different than the previous examples.
It will add a new line with a value like, pdf_document: default.
This format is more general, allows the document have multiple output formats as well as configuration settings that allow more fine-grained control over the look of the output format. The chapter R Markdown Formats discusses output formats for R markdown files in more detail.
27.3 Text formatting with Markdown
Exercise 27.3.1
Practice what you’ve learned by creating a brief CV. The title should be your name, and you should include headings for (at least) education or employment. Each of the sections should include a bulleted list of jobs/degrees. Highlight the year in bold.
A minimal example is the following CV.
---
title: "Hadley Wickham"
---

## Employment

-   Chief Scientist, Rstudio, **2013--present**.
-   Adjust Professor, Rice University, Houston, TX, **2013--present**.
-   Assistant Professor, Rice University, Houston, TX, **2008--12**.

## Education

-   Ph.D. in Statistics, Iowa State University, Ames, IA,  **2008**

-   M.Sc. in Statistics, University of Auckland, New Zealand, **2004**

-   B.Sc. in Statistics and Computer Science, First Class Honours, The
    University of Auckland, New Zealand, **2002**.

-   Bachelor of Human Biology, First Class Honours, The University of Auckland,
    Auckland, New Zealand, **1999**.
Your own example could be much more detailed.
Exercise 27.3.2
Using the R Markdown quick reference, figure out how to:
- Add a footnote.
- Add a horizontal rule.
- Add a block quote.
---
title: Horizontal Rules, Block Quotes, and Footnotes
---

The quick brown fox jumped over the lazy dog.[^quick-fox]

Use three or more `-` for a horizontal rule. For example,

---

The horizontal rule uses the same syntax as a YAML block? So how does R markdown
distinguish between the two?  Three dashes ("---") is only treated the start of
a YAML block if it is at the start of the document.

> This would be a block quote. Generally, block quotes are used to indicate
> quotes longer than a three or four lines.

[^quick-fox]: This is an example of a footnote. The sentence this is footnoting
  is often used for displaying fonts because it includes all 26 letters of the
  English alphabet.
Exercise 27.3.3
Copy and paste the contents of diamond-sizes.Rmd from https://github.com/hadley/r4ds/tree/master/rmarkdown in to a local R markdown document.
Check that you can run it, then add text after the frequency polygon that describes its most striking features.
The following R markdown document answers this question as well as exercises Exercise 27.4.1, Exercise 27.4.2, and Exercise 27.4.3.
---
title: "Diamond sizes"
output: html_document
date: '2018-07-15'
---

```{r knitr_opts, include = FALSE}
knitr::opts_chunk$set(echo = FALSE)
```

```{r setup, message = FALSE}
library("ggplot2")
library("dplyr")
```

```{r}
smaller <- diamonds %>%
  filter(carat <= 2.5)
```

```{r include = FALSE, purl = FALSE}
# Hide objects and functions ONLY used inline
n_larger <- nrow(diamonds) - nrow(smaller)
pct_larger <- n_larger / nrow(diamonds) * 100

comma <- function(x) {
  format(x, digits = 2, big.mark = ",")
}
```

## Size and Cut, Color, and Clarity

Diamonds with lower quality cuts (cuts are ranked from "Ideal" to "Fair") tend
to be be larger.
```{r}
ggplot(diamonds, aes(y = carat, x = cut)) +
  geom_boxplot()
```
Likewise, diamonds with worse color (diamond colors are ranked from J (worst)
to D (best)) tend to be larger:

```{r}
ggplot(diamonds, aes(y = carat, x = color)) +
  geom_boxplot()
```

The pattern present in cut and color is also present in clarity. Diamonds with
worse clarity  (I1 (worst), SI1, SI2, VS1, VS2, VVS1, VVS2, IF (best)) tend to
be larger:

```{r}
ggplot(diamonds, aes(y = carat, x = clarity)) +
  geom_boxplot()
```

These patterns are consistent with there being a profitability threshold for
retail diamonds that is a function of carat, clarity, color, cut and other
characteristics. A diamond may be profitable to sell if a poor value of one
feature, for example, poor clarity, color, or cut, is be offset by a good value
of another feature, such as a large size. This can be considered an example
of [Berkson's paradox](https://en.wikipedia.org/wiki/Berkson%27s_paradox).

## Largest Diamonds

We have data about `r comma(nrow(diamonds))` diamonds. Only
`r n_larger` (`r round(pct_larger, 1)`%) are larger
than 2.5 carats. The distribution of the remainder is shown below:

```{r}
smaller %>%
  ggplot(aes(carat)) +
  geom_freqpoly(binwidth = 0.01)
```

The frequency distribution of diamond sizes is marked by spikes at
whole-number and half-carat values, as well as several other carat values
corresponding to fractions.

The largest twenty diamonds (by carat) in the datasets are,

```{r results = "asis"}
diamonds %>%
  arrange(desc(carat)) %>%
  slice(1:20) %>%
  select(carat, cut, color, clarity) %>%
  knitr::kable(
    caption = "The largest 20 diamonds in the `diamonds` dataset."
  )
```

Most of the twenty largest datasets are in the lowest clarity category ("I1"),
with one being in the second best category ("VVS2") The top twenty diamonds
have colors ranging from the worst, "J", to best, "D",categories, though most
are in the lower categories "J" and "I". The top twenty diamonds are more evenly
distributed among the cut categories, from "Fair" to "Ideal", although the worst
category (Fair) is the most common.
27.4 Code chunks
Exercise 27.4.1
Add a section that explores how diamond sizes vary by cut, color, and clarity.
Assume you’re writing a report for someone who doesn’t know R, and instead of setting echo = FALSE on each chunk, set a global option.
See the answer to Exercise 27.3.3.
Exercise 27.4.2
Download diamond-sizes.Rmd from https://github.com/hadley/r4ds/tree/master/rmarkdown.
Add a section that describes the largest 20 diamonds, including a table that displays their most important attributes.
See the answer to Exercise 27.3.3.
I use arrange() and slice() to select the largest twenty diamonds, and
knitr::kable() to produce a formatted table.
Exercise 27.4.3
Modify diamonds-sizes.Rmd to use comma() to produce nicely formatted output.
Also include the percentage of diamonds that are larger than 2.5 carats.
See the answer to Exercise 27.3.3.
I moved the computation of the number larger and percent of diamonds larger than 2.5 carats into a code chunk.
I find that it is best to keep inline R expressions simple, usually consisting of an object and a formatting function.
This makes it both easier to read and test the R code, while simultaneously making the prose easier to read.
It helps the readability of the code and document to keep the computation of objects used in prose close to their use.
Calculating those objects in a code chunk with the include = FALSE option (as is done in diamonds-size.Rmd) is useful in this regard.
Exercise 27.4.4
Set up a network of chunks where d depends on c and b, and both b and c depend on a. Have each chunk print lubridate::now(), set cache = TRUE, then verify your understanding of caching.
---
title: "Exercise 24.4.7.4"
author: "Jeffrey Arnold"
date: "2/1/2018"
output: html_document
---

```{r setup, include=FALSE}
knitr::opts_chunk$set(echo = TRUE, cache = TRUE)
```

The chunk `a` has no dependencies.
```{r a}
print(lubridate::now())
x <- 1
```

The chunk `b` depends on `a`.
```{r b, dependson = c("a")}
print(lubridate::now())
y <- x + 1
```

The chunk `c` depends on `a`.
```{r c, dependson = c("a")}
print(lubridate::now())
z <- x * 2
```

The chunk `d` depends on `c` and `b`:
```{r d, dependson = c("c", "b")}
print(lubridate::now())
w <- y + z
```

If this document is knit repeatedly, the value  printed by `lubridate::now()`
will be the same for all chunks, and the same as the first time the document
was run with caching.