10 Tibbles
This book is superseded.
These are solutions to the 1st edition of R for Data Science . A 2nd edition has since been published, with its own solutions to the exercises .
This site is no longer maintained. It is kept online for reference.
library("tidyverse")
#> Warning: package 'purrr' was built under R version 4.0.5
Exercise 10.1
How can you tell if an object is a tibble? (Hint: try printing mtcars, which is a regular data frame).
When we print mtcars, it prints all the columns.
mtcars
#>                      mpg cyl  disp  hp drat   wt qsec vs am gear carb
#> Mazda RX4           21.0   6 160.0 110 3.90 2.62 16.5  0  1    4    4
#> Mazda RX4 Wag       21.0   6 160.0 110 3.90 2.88 17.0  0  1    4    4
#> Datsun 710          22.8   4 108.0  93 3.85 2.32 18.6  1  1    4    1
#> Hornet 4 Drive      21.4   6 258.0 110 3.08 3.21 19.4  1  0    3    1
#> Hornet Sportabout   18.7   8 360.0 175 3.15 3.44 17.0  0  0    3    2
#> Valiant             18.1   6 225.0 105 2.76 3.46 20.2  1  0    3    1
#> Duster 360          14.3   8 360.0 245 3.21 3.57 15.8  0  0    3    4
#> Merc 240D           24.4   4 146.7  62 3.69 3.19 20.0  1  0    4    2
#> Merc 230            22.8   4 140.8  95 3.92 3.15 22.9  1  0    4    2
#> Merc 280            19.2   6 167.6 123 3.92 3.44 18.3  1  0    4    4
#> Merc 280C           17.8   6 167.6 123 3.92 3.44 18.9  1  0    4    4
#> Merc 450SE          16.4   8 275.8 180 3.07 4.07 17.4  0  0    3    3
#> Merc 450SL          17.3   8 275.8 180 3.07 3.73 17.6  0  0    3    3
#> Merc 450SLC         15.2   8 275.8 180 3.07 3.78 18.0  0  0    3    3
#> Cadillac Fleetwood  10.4   8 472.0 205 2.93 5.25 18.0  0  0    3    4
#> Lincoln Continental 10.4   8 460.0 215 3.00 5.42 17.8  0  0    3    4
#> Chrysler Imperial   14.7   8 440.0 230 3.23 5.34 17.4  0  0    3    4
#> Fiat 128            32.4   4  78.7  66 4.08 2.20 19.5  1  1    4    1
#> Honda Civic         30.4   4  75.7  52 4.93 1.61 18.5  1  1    4    2
#> Toyota Corolla      33.9   4  71.1  65 4.22 1.83 19.9  1  1    4    1
#> Toyota Corona       21.5   4 120.1  97 3.70 2.46 20.0  1  0    3    1
#> Dodge Challenger    15.5   8 318.0 150 2.76 3.52 16.9  0  0    3    2
#> AMC Javelin         15.2   8 304.0 150 3.15 3.44 17.3  0  0    3    2
#> Camaro Z28          13.3   8 350.0 245 3.73 3.84 15.4  0  0    3    4
#> Pontiac Firebird    19.2   8 400.0 175 3.08 3.85 17.1  0  0    3    2
#> Fiat X1-9           27.3   4  79.0  66 4.08 1.94 18.9  1  1    4    1
#> Porsche 914-2       26.0   4 120.3  91 4.43 2.14 16.7  0  1    5    2
#> Lotus Europa        30.4   4  95.1 113 3.77 1.51 16.9  1  1    5    2
#> Ford Pantera L      15.8   8 351.0 264 4.22 3.17 14.5  0  1    5    4
#> Ferrari Dino        19.7   6 145.0 175 3.62 2.77 15.5  0  1    5    6
#> Maserati Bora       15.0   8 301.0 335 3.54 3.57 14.6  0  1    5    8
#> Volvo 142E          21.4   4 121.0 109 4.11 2.78 18.6  1  1    4    2
But when we first convert mtcars to a tibble using as_tibble(), it prints only the first ten observations.
There are also some other differences in formatting of the printed data frame.
It prints the number of rows and columns and the date type of each column.
as_tibble(mtcars)
#> # A tibble: 32 x 11
#>     mpg   cyl  disp    hp  drat    wt  qsec    vs    am  gear  carb
#>   <dbl> <dbl> <dbl> <dbl> <dbl> <dbl> <dbl> <dbl> <dbl> <dbl> <dbl>
#> 1  21       6   160   110  3.9   2.62  16.5     0     1     4     4
#> 2  21       6   160   110  3.9   2.88  17.0     0     1     4     4
#> 3  22.8     4   108    93  3.85  2.32  18.6     1     1     4     1
#> 4  21.4     6   258   110  3.08  3.22  19.4     1     0     3     1
#> 5  18.7     8   360   175  3.15  3.44  17.0     0     0     3     2
#> 6  18.1     6   225   105  2.76  3.46  20.2     1     0     3     1
#> # … with 26 more rows
You can use the function is_tibble() to check whether a data frame is a tibble or not.
The mtcars data frame is not a tibble.
is_tibble(mtcars)
#> [1] FALSE
But the diamonds and flights data are tibbles.
is_tibble(ggplot2::diamonds)
#> [1] TRUE
is_tibble(nycflights13::flights)
#> [1] TRUE
is_tibble(as_tibble(mtcars))
#> [1] TRUE
More generally, you can use the class() function to find out the class of an
object. Tibbles has the classes c("tbl_df", "tbl", "data.frame"), while old
data frames will only have the class "data.frame".
class(mtcars)
#> [1] "data.frame"
class(ggplot2::diamonds)
#> [1] "tbl_df"     "tbl"        "data.frame"
class(nycflights13::flights)
#> [1] "tbl_df"     "tbl"        "data.frame"
If you are interested in reading more on R’s classes, read the chapters on object oriented programming in Advanced R.
Exercise 10.2
Compare and contrast the following operations on a data.frame and equivalent tibble. What is different? Why might the default data frame behaviors cause you frustration?
df <- data.frame(abc = 1, xyz = "a")
df$x
#> [1] "a"
df[, "xyz"]
#> [1] "a"
df[, c("abc", "xyz")]
#>   abc xyz
#> 1   1   a
tbl <- as_tibble(df)
tbl$x
#> Warning: Unknown or uninitialised column: `x`.
#> NULL
tbl[, "xyz"]
#> # A tibble: 1 x 1
#> xyz
#> <chr>
#> 1 a
tbl[, c("abc", "xyz")]
#> # A tibble: 1 x 2
#> abc xyz
#> <dbl> <chr>
#> 1 1 aThe $ operator will match any column name that starts with the name following it.
Since there is a column named xyz, the expression df$x will be expanded to df$xyz.
This behavior of the $ operator saves a few keystrokes, but it can result in accidentally using a different column than you thought you were using.
With data.frames, with [ the type of object that is returned differs on the
number of columns. If it is one column, it won’t return a data.frame, but
instead will return a vector. With more than one column, then it will return a
data.frame. This is fine if you know what you are passing in, but suppose you
did df[ , vars] where vars was a variable. Then what that code does
depends on length(vars) and you’d have to write code to account for those
situations or risk bugs.
Exercise 10.3
If you have the name of a variable stored in an object, e.g. var <- "mpg", how can you extract the reference variable from a tibble?
You can use the double bracket, like df[[var]]. You cannot use the dollar sign, because df$var would look for a column named var.
Exercise 10.4
Practice referring to non-syntactic names in the following data frame by:
- Extracting the variable called 1.
- Plotting a scatterplot of 1 vs 2.
- Creating a new column called 3 which is 2 divided by 1.
- Renaming the columns to one, two and three.
For this example, I’ll create a dataset called annoying with
columns named 1 and 2.
annoying <- tibble(
  `1` = 1:10,
  `2` = `1` * 2 + rnorm(length(`1`))
)
To extract the variable named
1:annoying[["1"]] #> [1] 1 2 3 4 5 6 7 8 9 10or
annoying$`1`
#>  [1]  1  2  3  4  5  6  7  8  9 10
To create a scatter plot of
1vs.2:ggplot(annoying, aes(x = `1`, y = `2`)) + geom_point()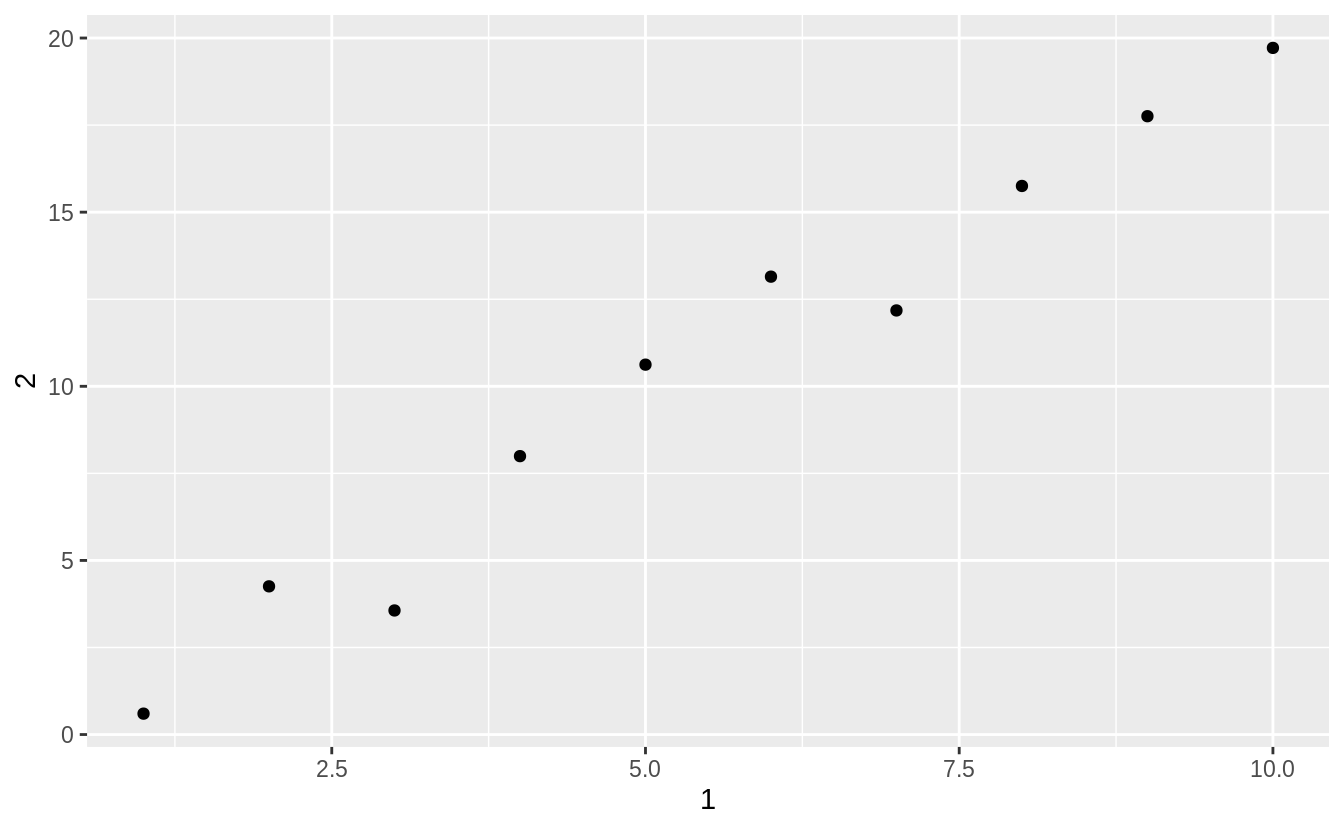
To add a new column
3which is2divided by1:mutate(annoying, `3` = `2` / `1`) #> # A tibble: 10 x 3 #> `1` `2` `3` #> <int> <dbl> <dbl> #> 1 1 0.600 0.600 #> 2 2 4.26 2.13 #> 3 3 3.56 1.19 #> 4 4 7.99 2.00 #> 5 5 10.6 2.12 #> 6 6 13.1 2.19 #> # … with 4 more rowsor
annoying[["3"]] <- annoying$`2` / annoying$`1`or
annoying[["3"]] <- annoying[["2"]] / annoying[["1"]]To rename the columns to
one,two, andthree, run:annoying <- rename(annoying, one = `1`, two = `2`, three = `3`) glimpse(annoying) #> Rows: 10 #> Columns: 3 #> $ one <int> 1, 2, 3, 4, 5, 6, 7, 8, 9, 10 #> $ two <dbl> 0.60, 4.26, 3.56, 7.99, 10.62, 13.15, 12.18, 15.75, 17.76, 19.72 #> $ three <dbl> 0.60, 2.13, 1.19, 2.00, 2.12, 2.19, 1.74, 1.97, 1.97, 1.97
Exercise 10.5
What does tibble::enframe() do? When might you use it?
The function tibble::enframe() converts named vectors to a data frame with names and values
enframe(c(a = 1, b = 2, c = 3))
#> # A tibble: 3 x 2
#>   name  value
#>   <chr> <dbl>
#> 1 a         1
#> 2 b         2
#> 3 c         3
Exercise 10.6
What option controls how many additional column names are printed at the footer of a tibble?
The help page for the print() method of tibble objects is discussed in ?print.tbl.
The n_extra argument determines the number of extra columns to print information for.